Hexbin and heatmaps are two additional data visualization tools that can be used in the Map view to provide more context for your data.
Hexbins
Hexbins is short for hexagonal binning. This method can be applied to maps for visualizing aggregated data during analysis, and is great for large datasets.
When viewing trends on a map, the data points can sometimes overlap. This effect can make viewing the trends difficult. Hexbin maps help put this data into a context that is easy to understand.
How to add Hexbins on your Basemap
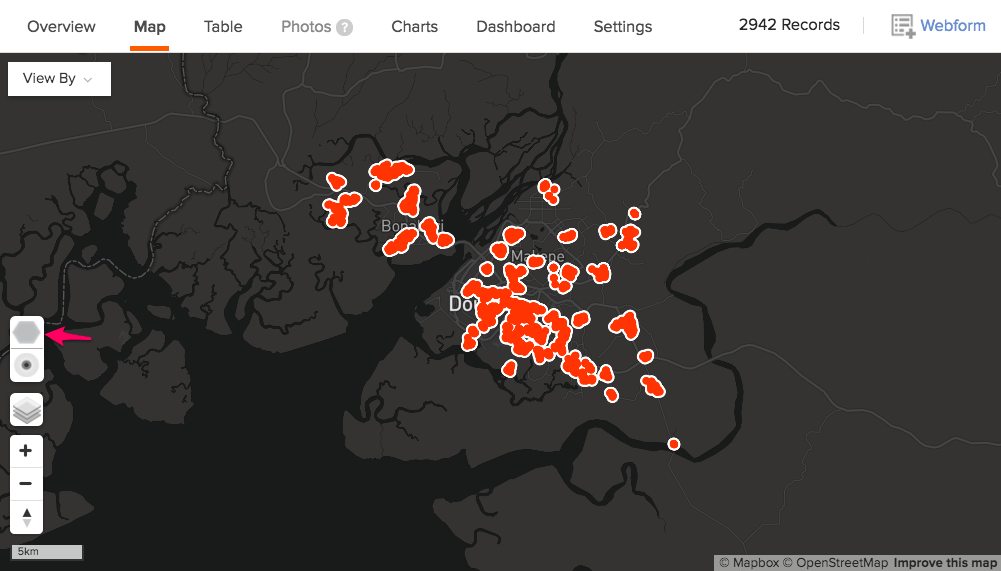
Hexbins can be viewed when visualizing your data on the basemaps as highlighted below. This is done on the Form’s Map view page.
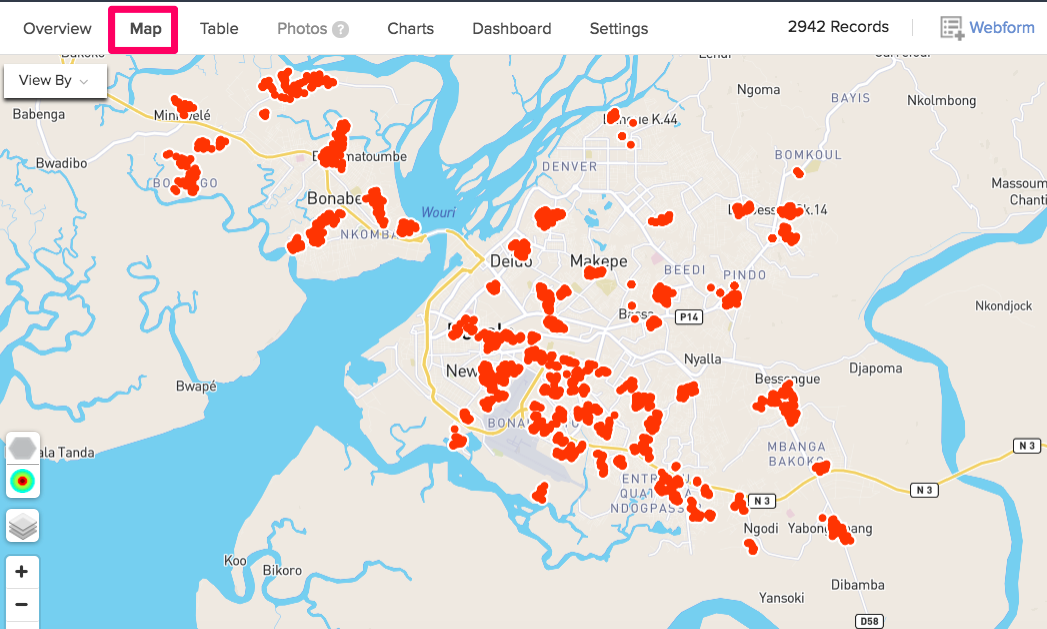
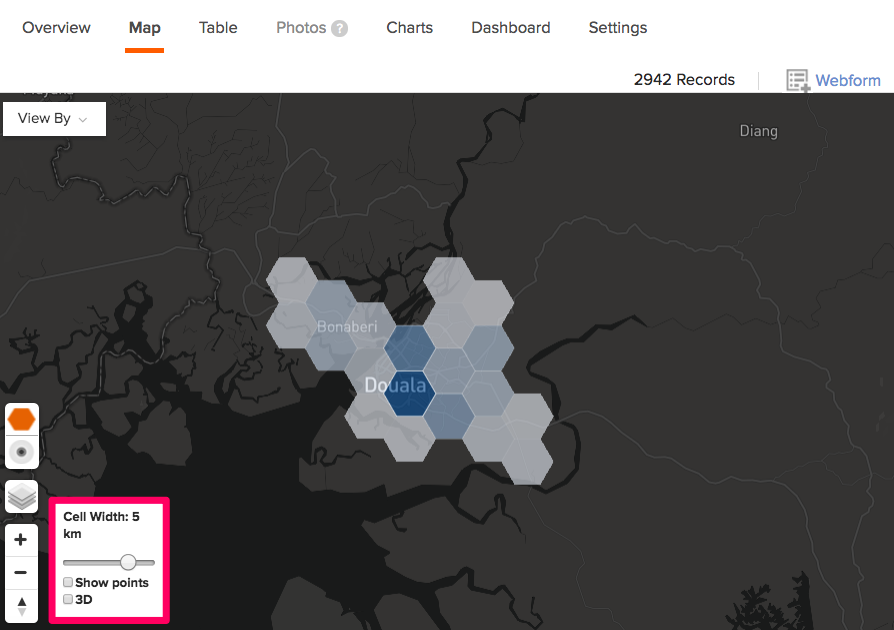
Select the polygon shaped icon on the map, as shown below, to add hexbins on the basemap.

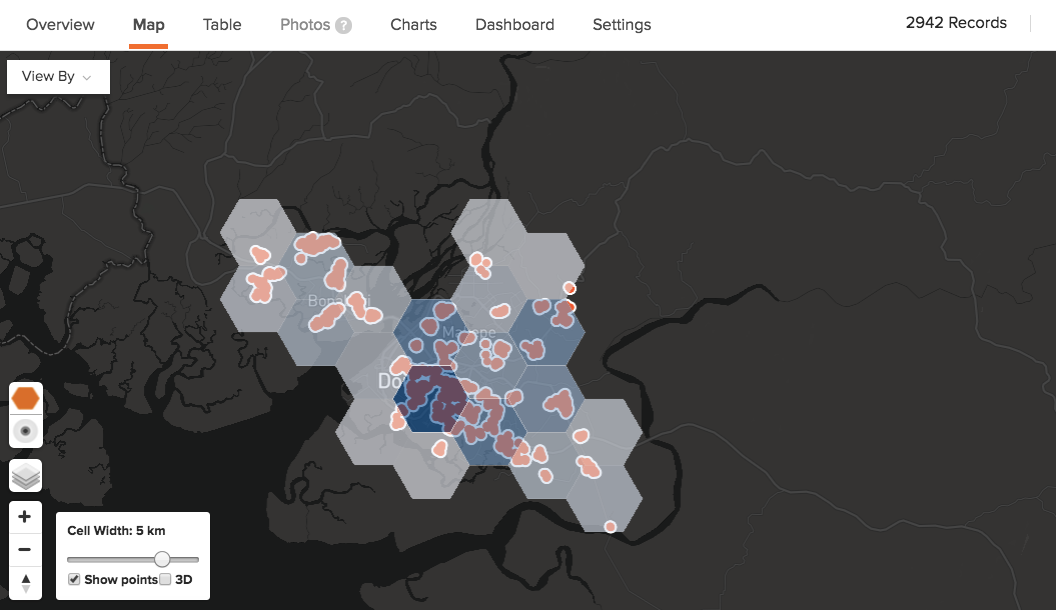
The hexbins will be displayed as below, where the dark blue indicates more data points compared to the lighter color with less data point. The hexbins will not be displayed where there are no data points.
The following are different hexbin settings you can set when editing your map view.
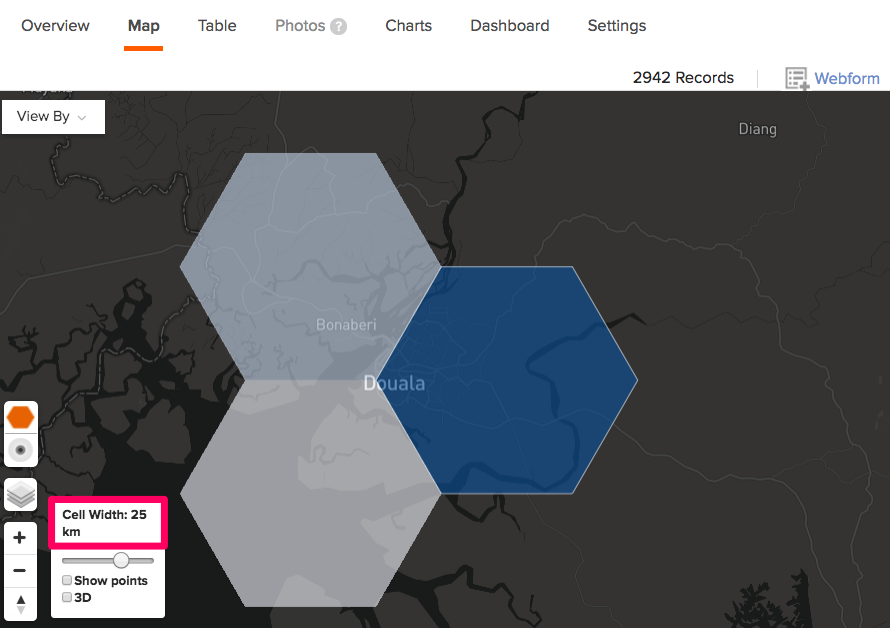
- Cell width – This allows you to adjust the size of the hexbins and ranges between 5 km to 500 km. Below, the map has the hexbin size as 25 km.
- Show points – You can opt to display the GPS points or not. To do this, select the Show Points check box. The red points on the image below show the GPS points on the dataset.

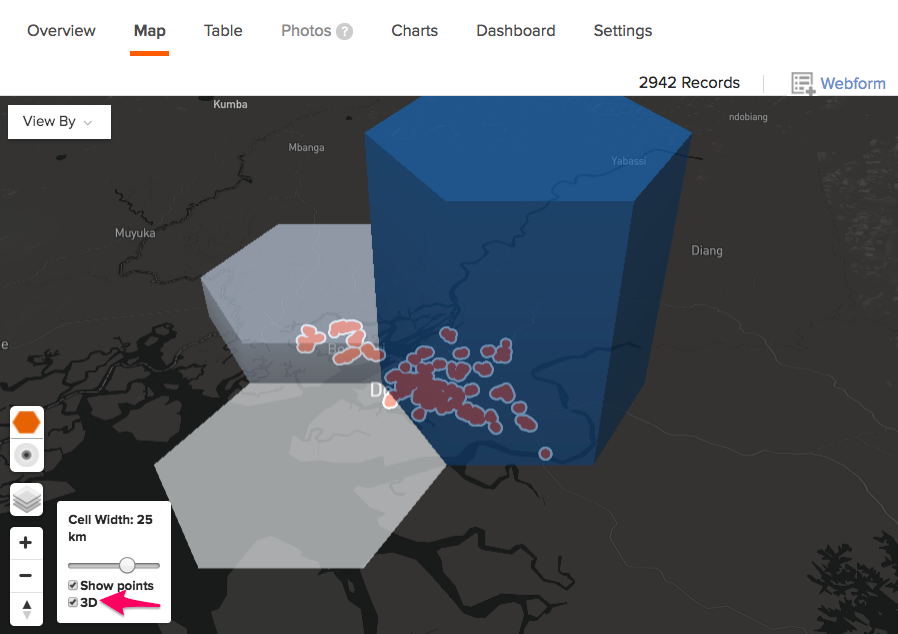
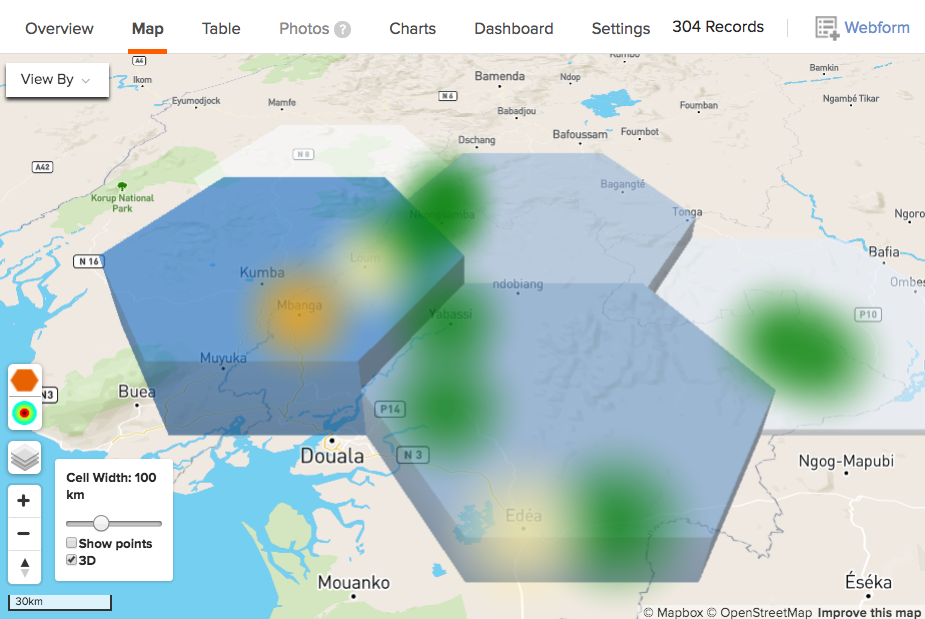
- 3D – You can also view the base map with hexbins in 3D by checking the highlighted option below.
Heatmaps
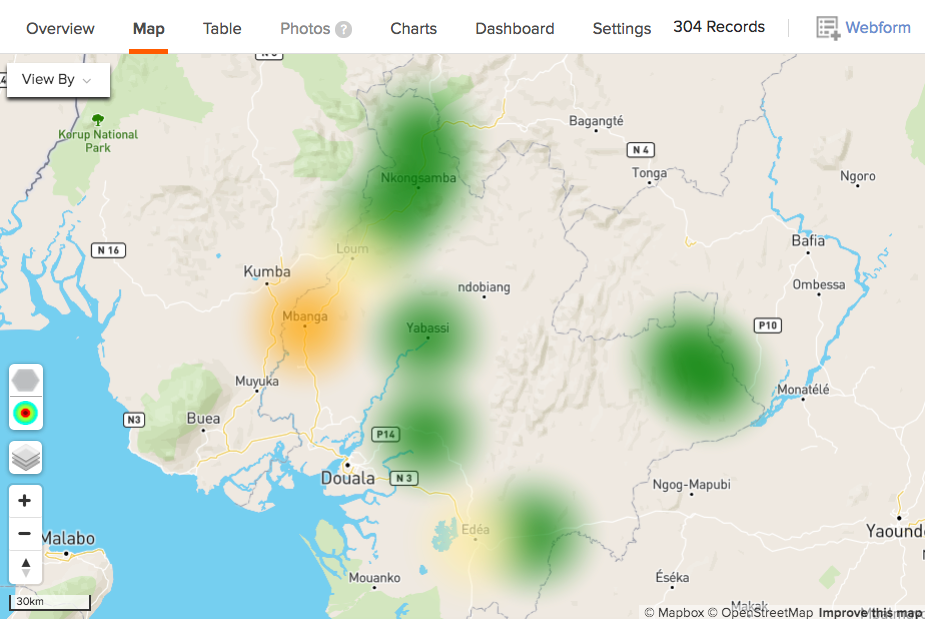
Heatmaps are also a good way to visualize aggregate data and analyse data. Heatmaps can use many different colour schemes, where a rainbow color scheme is a common choice. For example, you can instantly spot the most populated areas in a region or analyse the number of schools in a country when using a heatmap. This all depends on how your survey is structured.
How to add Heat Map on your Basemap
In the Map view, select the heatmap option, as shown below:
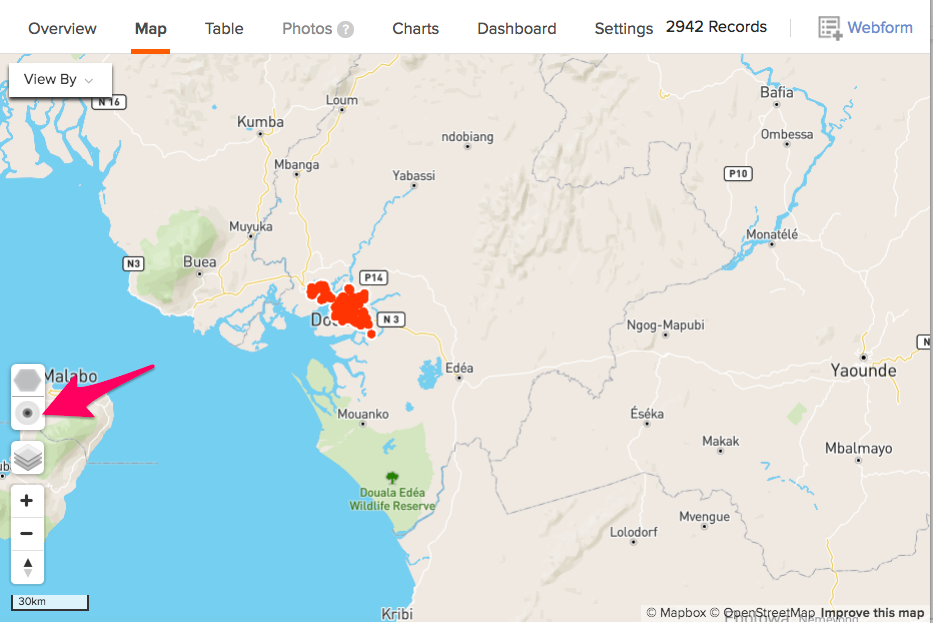
The areas with GPS points will be displayed on the map as below:

(Optional) One can select both heatmap and hexbin to be displayed in the map. The map may be displayed as shown below.
Note:
To utilize this feature, your survey must have collected GPS points. Follow this guide to add GPS points to your XLSForm.