Overview
An XLS Report is an analytic tool available to Ona users that allows you to create custom reports in Excel™ using your data on Ona. At the heart of XLS Reports is the flexible power of Excel. Everything that’s possible in Excel, from formulas to pivot tables to charts, can be used in your XLS Reports.
XLS Reports are always updated with your form’s latest data and can be downloaded at any time from the form’s Overview page.
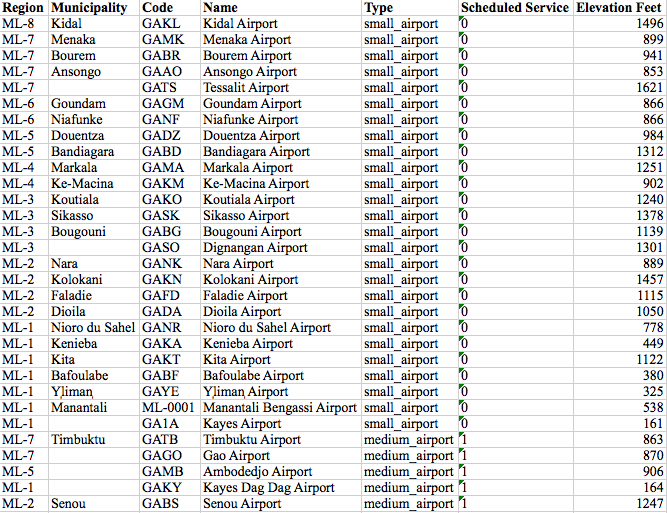
The sections below walk you through the steps of generating an XLS Report. The Mali Airports dataset is used as an example.
How do I create an XLS Report Template?
An XLS Report Template is the Excel file that is used to generate an XLS Report. An XLS Report Template contains the formulas, macros, and formatting that you want to be included in your final XLS Report. Once the XLS Report Template is uploaded to your form, Ona sends the template and the data to j2x.ona.io which then sends back a downloadable report.
Here is the XLS Report Template created for the Mali Airports dataset. You can use it to follow the instructions below.
Tags in an XLS Report Template
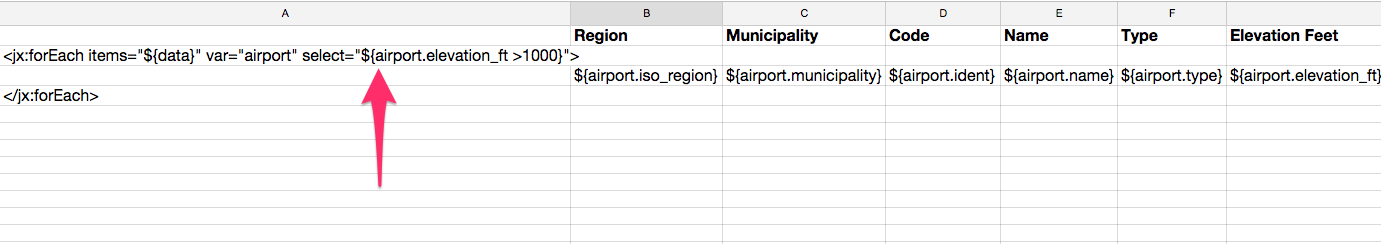
In order to generate a report based on specific parameters, you must indicate on the template what information is to be extracted from the data set. You will use jXLS tags to pull in the raw data.
A. <jx:forEach items= "${data}" var=”airport”>is called the opening tag. In your XLS Report Template, replace “airport” with a name that is relevant to your dataset.
After naming the dataset in the opening tag, you then order the dataset based on the parameters collected in the form. In the example above, we have ordered the “airport” dataset based on region, municipality, ident, name, type, scheduled service, and elevation parameters, which correspond to specific data fields in the form.
B. ${airport.iso_region} tag searches for iso_region from the airport dataset and puts it into the corresponding cell.
C. ${airport.municipality} tag searches for the municipality from the airport dataset and puts it into the corresponding cell.
D. ${airport.ident} tag searches for an ident from the airport dataset and puts it into the corresponding cell.
E. ${airport.name} tag searches for the name from the airport dataset and puts it into the corresponding cell.
F. ${airport.type} tag searches for a type from the airport dataset and puts it into the corresponding cell.
G. ${airport.scheduled_service} tag searches for scheduled service from the airport dataset and puts it into the corresponding cell.
H. ${airport.elevation_ft} tag searches for elevation from the airport dataset and puts it into the corresponding cell.
I. </jx:forEach> is known as the closing tag. It invokes the end of the dataset.
Note:
If the parameter is within a group in the form, remember to include the group name in your tag, e.g.${group_name_parameter_name}
When you upload the template and generate a report, you will get the following output:
How do I filter data in my report?
You can introduce filters into an XLS Template so as to retrieve only specific information. If you would like to share specific subsets of data you can be able to retrieve that from your dataset.
For example, you have a dataset capturing a number of mobile users in Africa; you can filter to view a dataset that only depicts mobile users in East Africa. You can as well filter the East African data set only to retrieve the number of mobile users in Kenya.
In our case, the filter function is introduced on the Mali Airport XLS Template only to display airports that are 1000 ft above ground level.
<jx:forEach items="${data}"var=“airport”select=“${airport.elevation_ft>1000}”>
The line of code above invokes that from the data named ‘airport’, you only retrieve elevation feet that are above 1000.
${airport.iso_region}|${airport.municipality}|${airport.ident}|${airport.name}|${airport.type}|${airport.deviation_ft}
The line of code above invokes that you retrieve information about the region, municipality, ident, name, type, and elevation feet. It is important to note that all the information retrieved will be subjected to our filter.
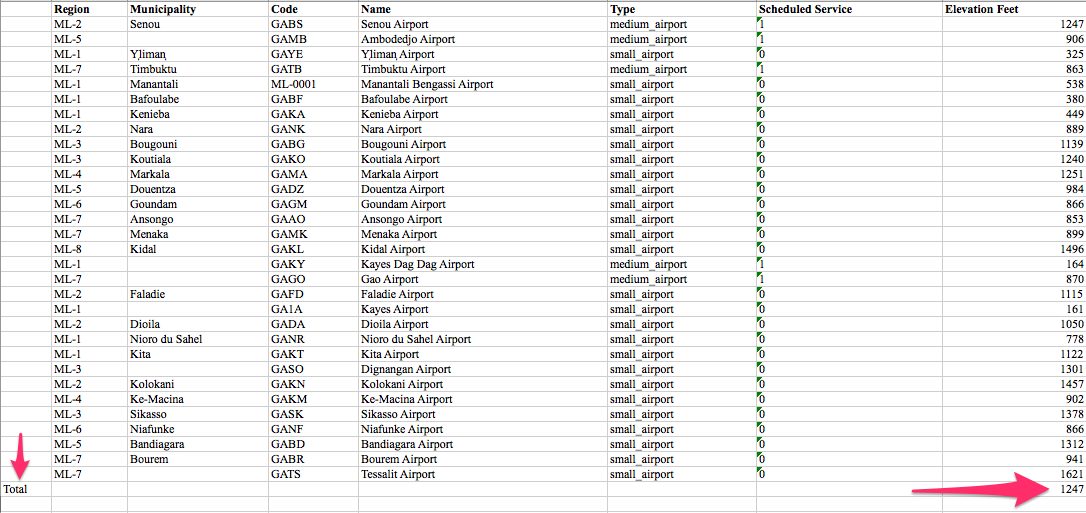
Below is an example of the report that is generated from the above template:
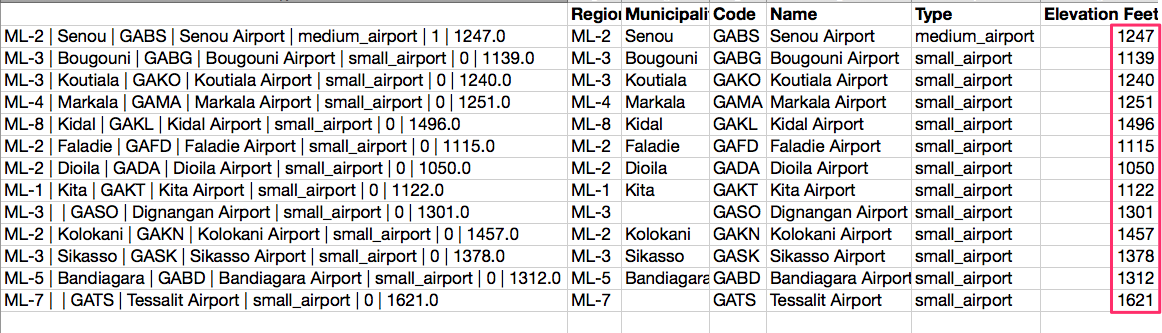
Note: All the elevation feet displayed in the above example are over 1000 feet.
How do I do a summation of my report?
You can sum values in a report by introducing a summation function on an XLS Template.
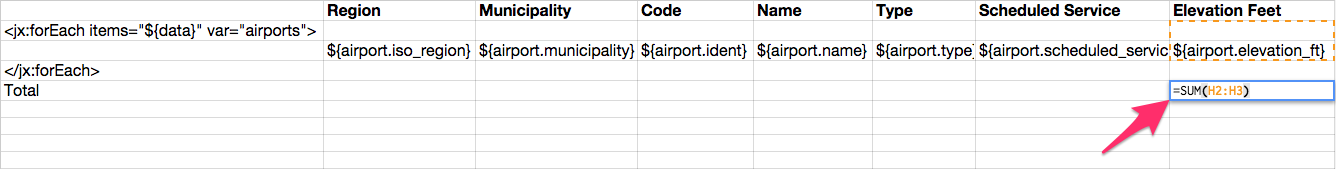
The Excel formula introduced above will sum the elevation feet values that will be generated in the report.
How can I generate charts or graphs in an XLS Report?
You can generate graphical representations on an XLS Report provided you introduce an Excel function into the XLS Template that will capture what you intend to graphically display.
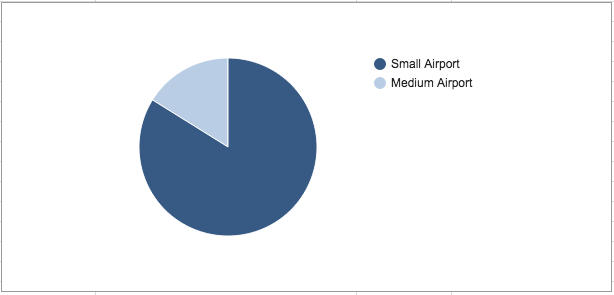
You can display a pie chart to show the distribution between the two types of airports in Mali (small airport and medium airport)
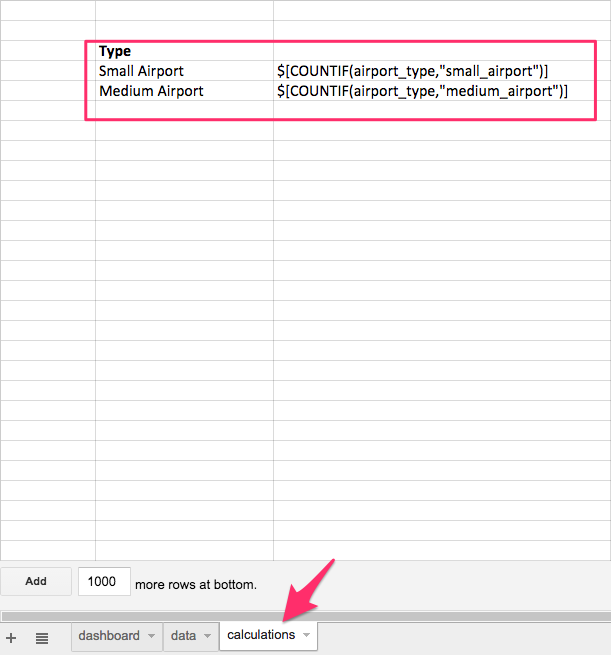
- Create a new worksheet on your template and call it calculations. This will hold the formula for getting the distribution between the two airports.
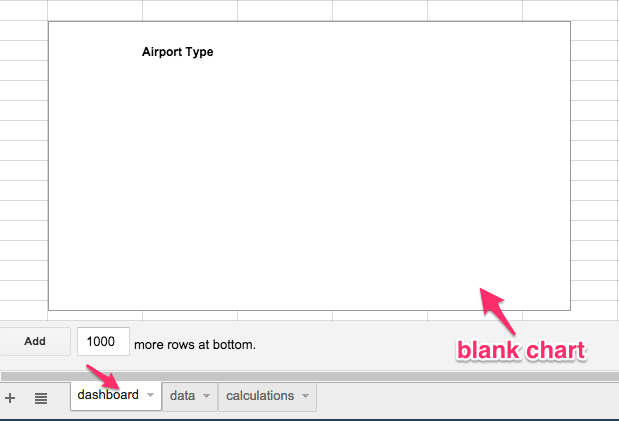
- Insert a new worksheet and call it dashboard. It will hold our blank chart.
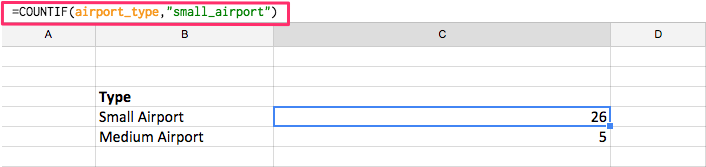
- You’ll generate the output below. On the calculation sheet, you’ll notice that when you click on a result (e.g 26) the formula being displayed is similar to the one we introduced in our XLS Template.
- When you switch to the dashboard sheet of the report you will view the following output.
Where do I upload my XLS Report Template?
Once your XLS Report Template is authored, follow the steps below to upload your template to your form:
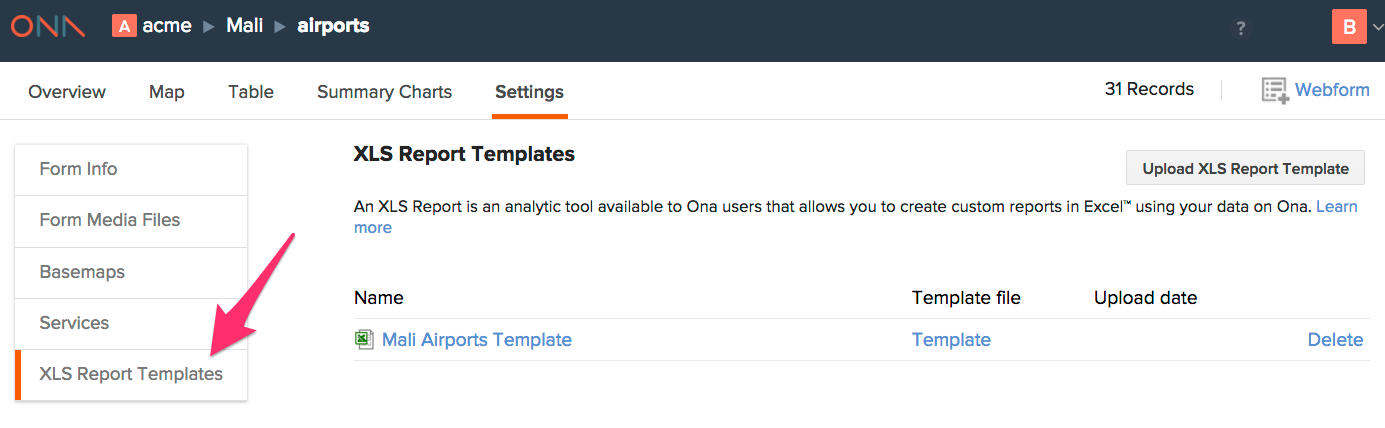
- In your project view, select the name of the form that you authored the XLS Report Template for; navigate to the form’s Settings tab, then click XLS Report Templates option on the left;
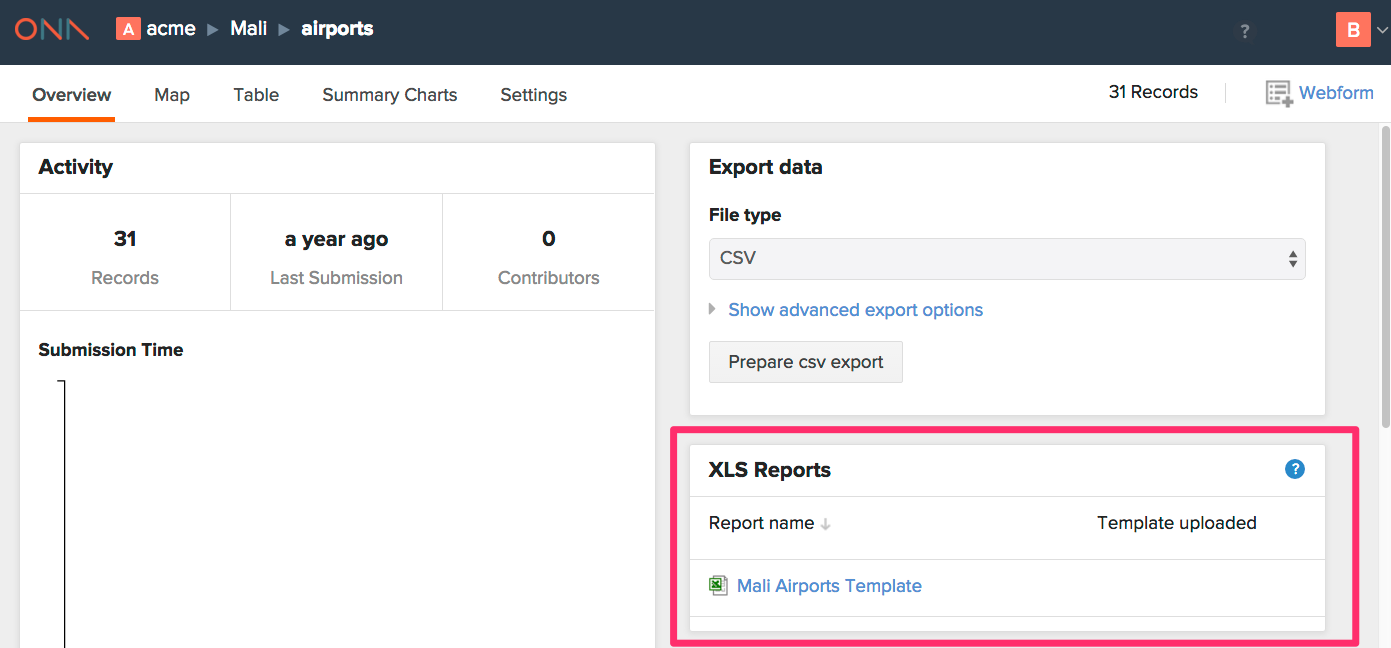
- Once your template is uploaded, you can download the XLS Report that is generated from the form’s Overview page, scroll down to the XLS Reports section;
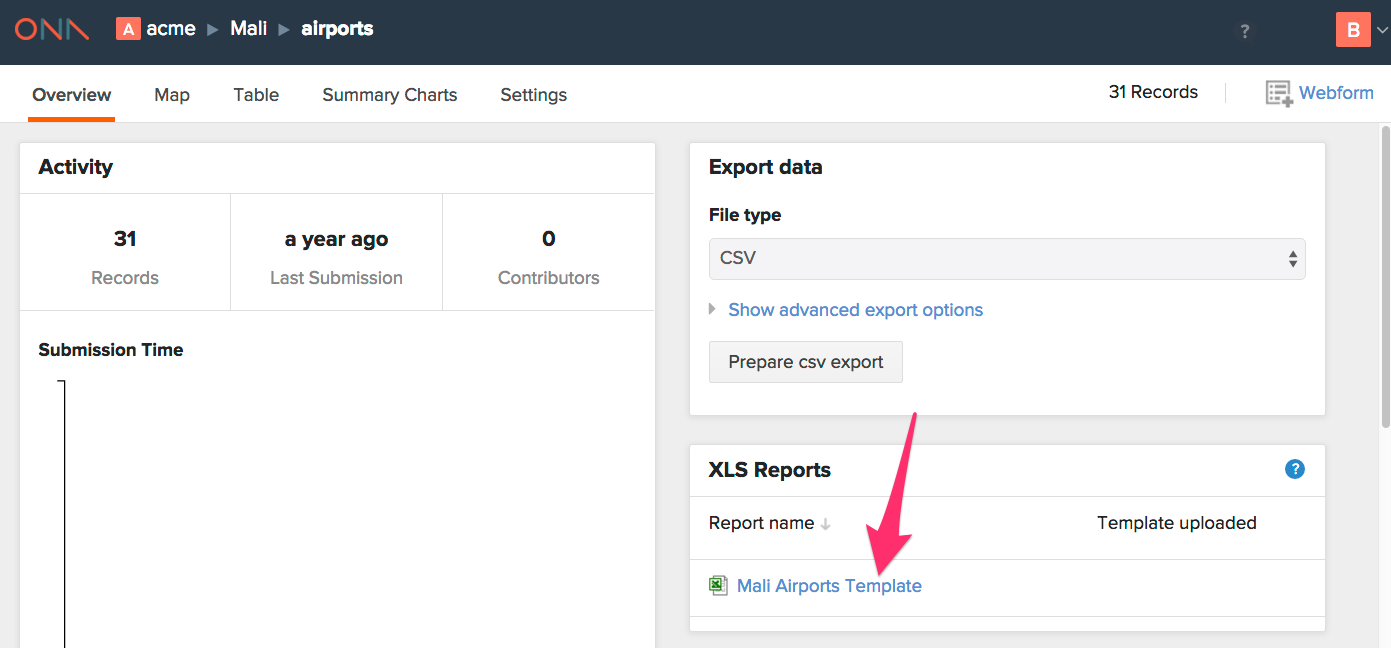
- Click on the name of the XLS Report Template that you previously uploaded to download it to your computer;
Note:
- This feature is currently in beta. If your template has an error, the report generated will be blank. If you experience this, go through each and every aspect of your template to diagnose the error and upload the template afresh.
- XLS Reports that contain large datasets may fail to download and result in a timeout error. Please notify the Ona team when this happens.
If you have MySQL Workbench installed with an Excel COM add-in, you must disable any MySQL add-ins for Excel so as to be in a position to successfully generate an XLS Report.
This is the case because Excel add-ins hide names and other junk to an excel spreadsheet and therefore will break any scripting you added to the template tab.