Submitted data can be viewed by loading the form on Ona.
Overview Page
This is the first page of the form. The Overview page gives a general summary of your data. There are several smaller sections within the Overview page.
The Activity log depicts the number of records submitted to a form, the last date when data was submitted, and the number of contributors submitting data.
The Submissions graph under this window displays real-time data, and you can check the number of submissions made on certain dates by moving your cursor over the graph.
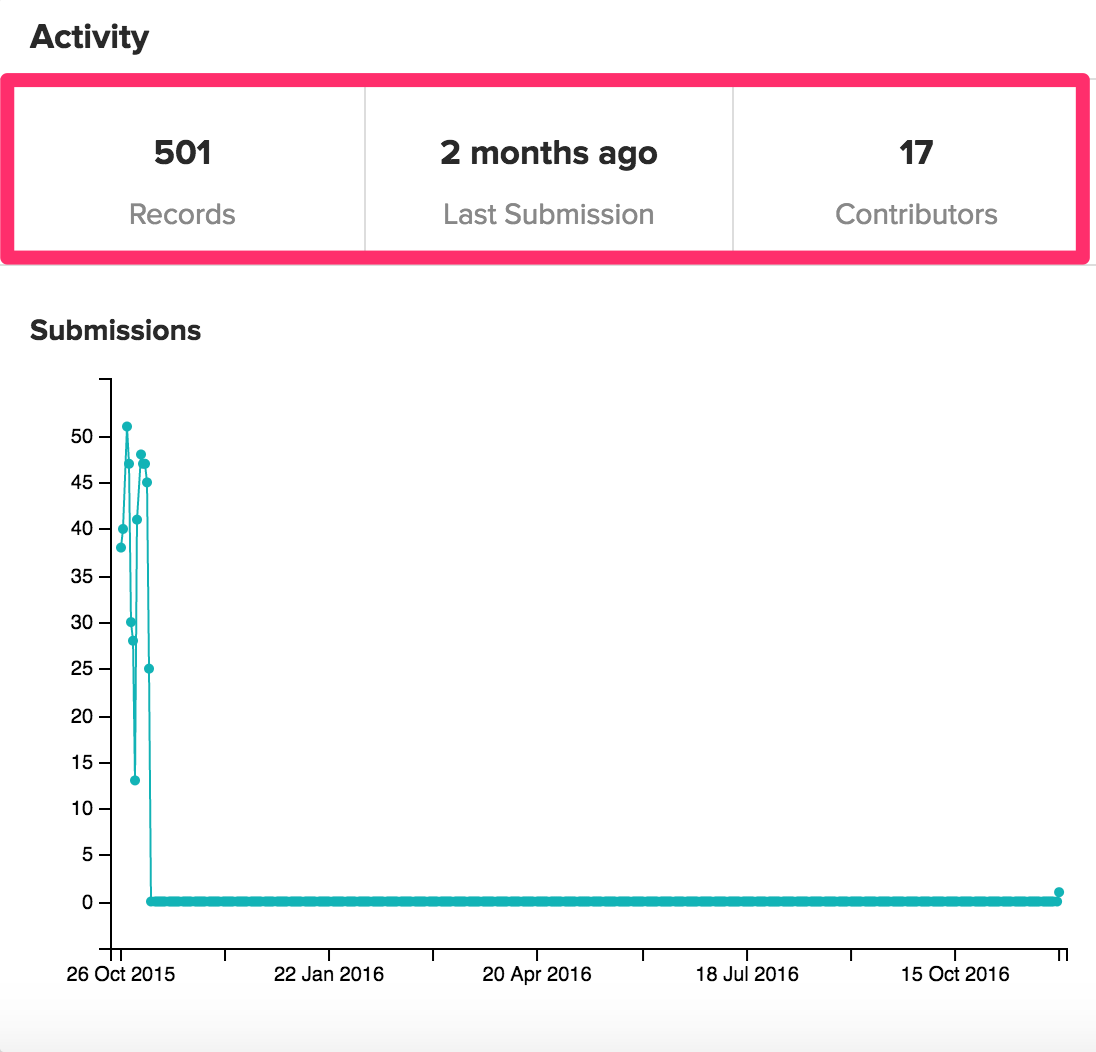
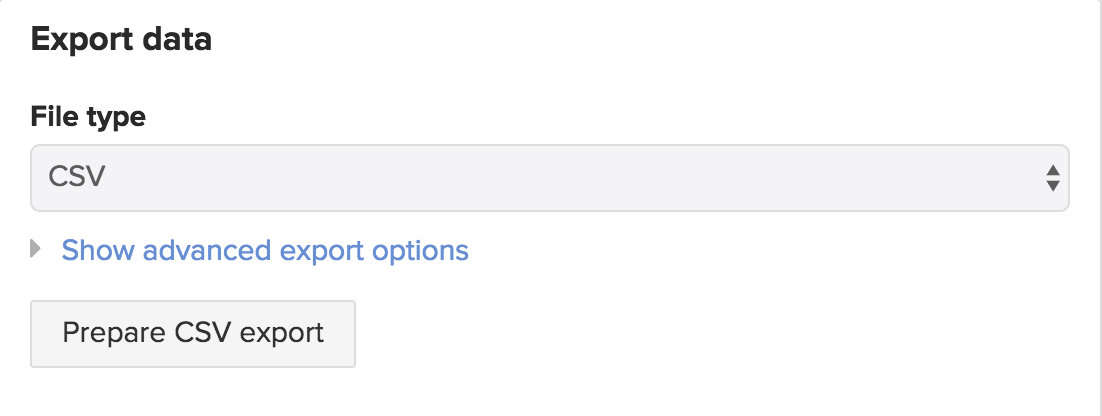
It’s from the Overview; page that you can export your data under the Export data section. This section will be discussed in more detail in the exporting data portion of this guide.
This page also displays a description of your survey if it had been included in the form’s Settings page.

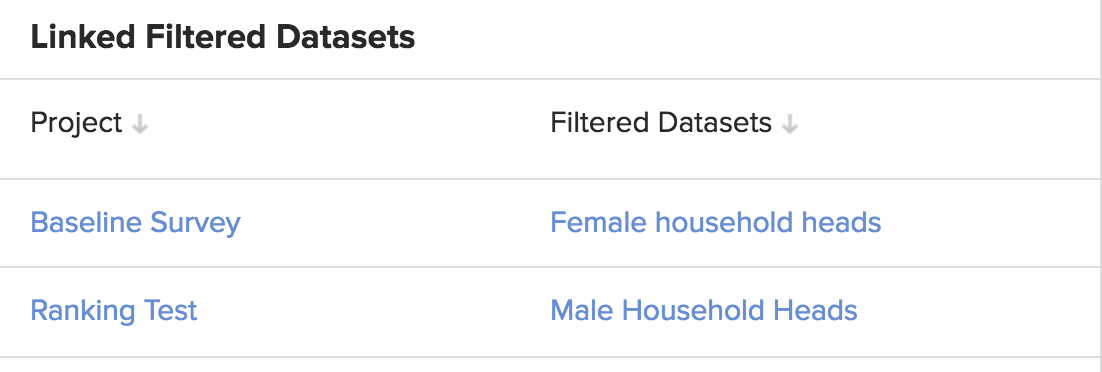
Filtered datasets associated with the form are displayed under the Linked Filtered Dataset section of the Overview page. This includes filtered datasets saved in different projects other than the one in which the form is. Both the project and dataset names are indicated.
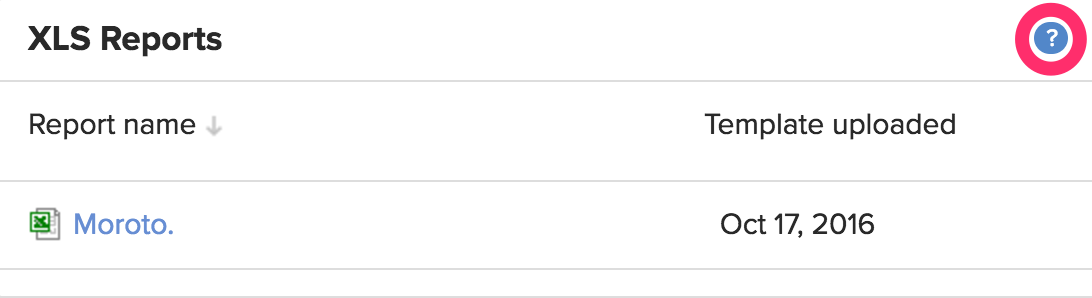
You can see the XLS Report templates uploaded to the form under the XLS Reports section. The XLS Report can be downloaded from this page by clicking on the report name. When you click on the help icon, it redirects you to the XLS Reports faq page.
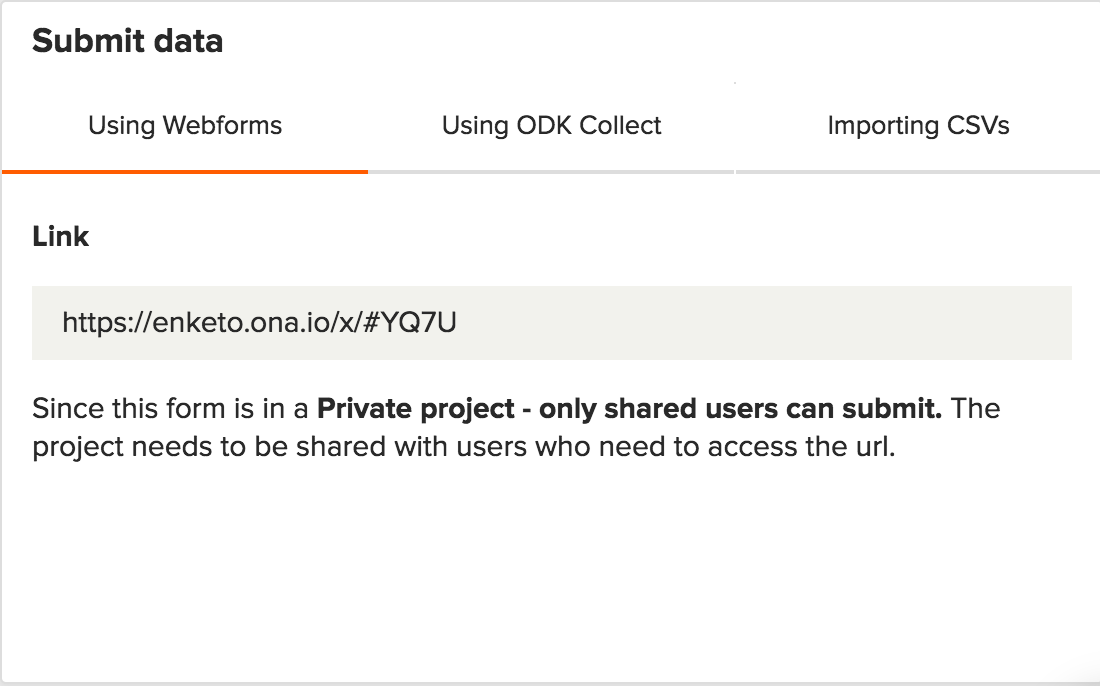
The Submit data section includes links to use when collecting data using either Enketo or ODK Collect.
It’s under this section that you can upload form submissions to a blank form using the Import CSV feature.
Map View
For a form that contains GPS points, the data will automatically show up in the Map tab as points or geo shapes. You can click on any point to view all the data (including images) associated with that point on the map single submission popup.
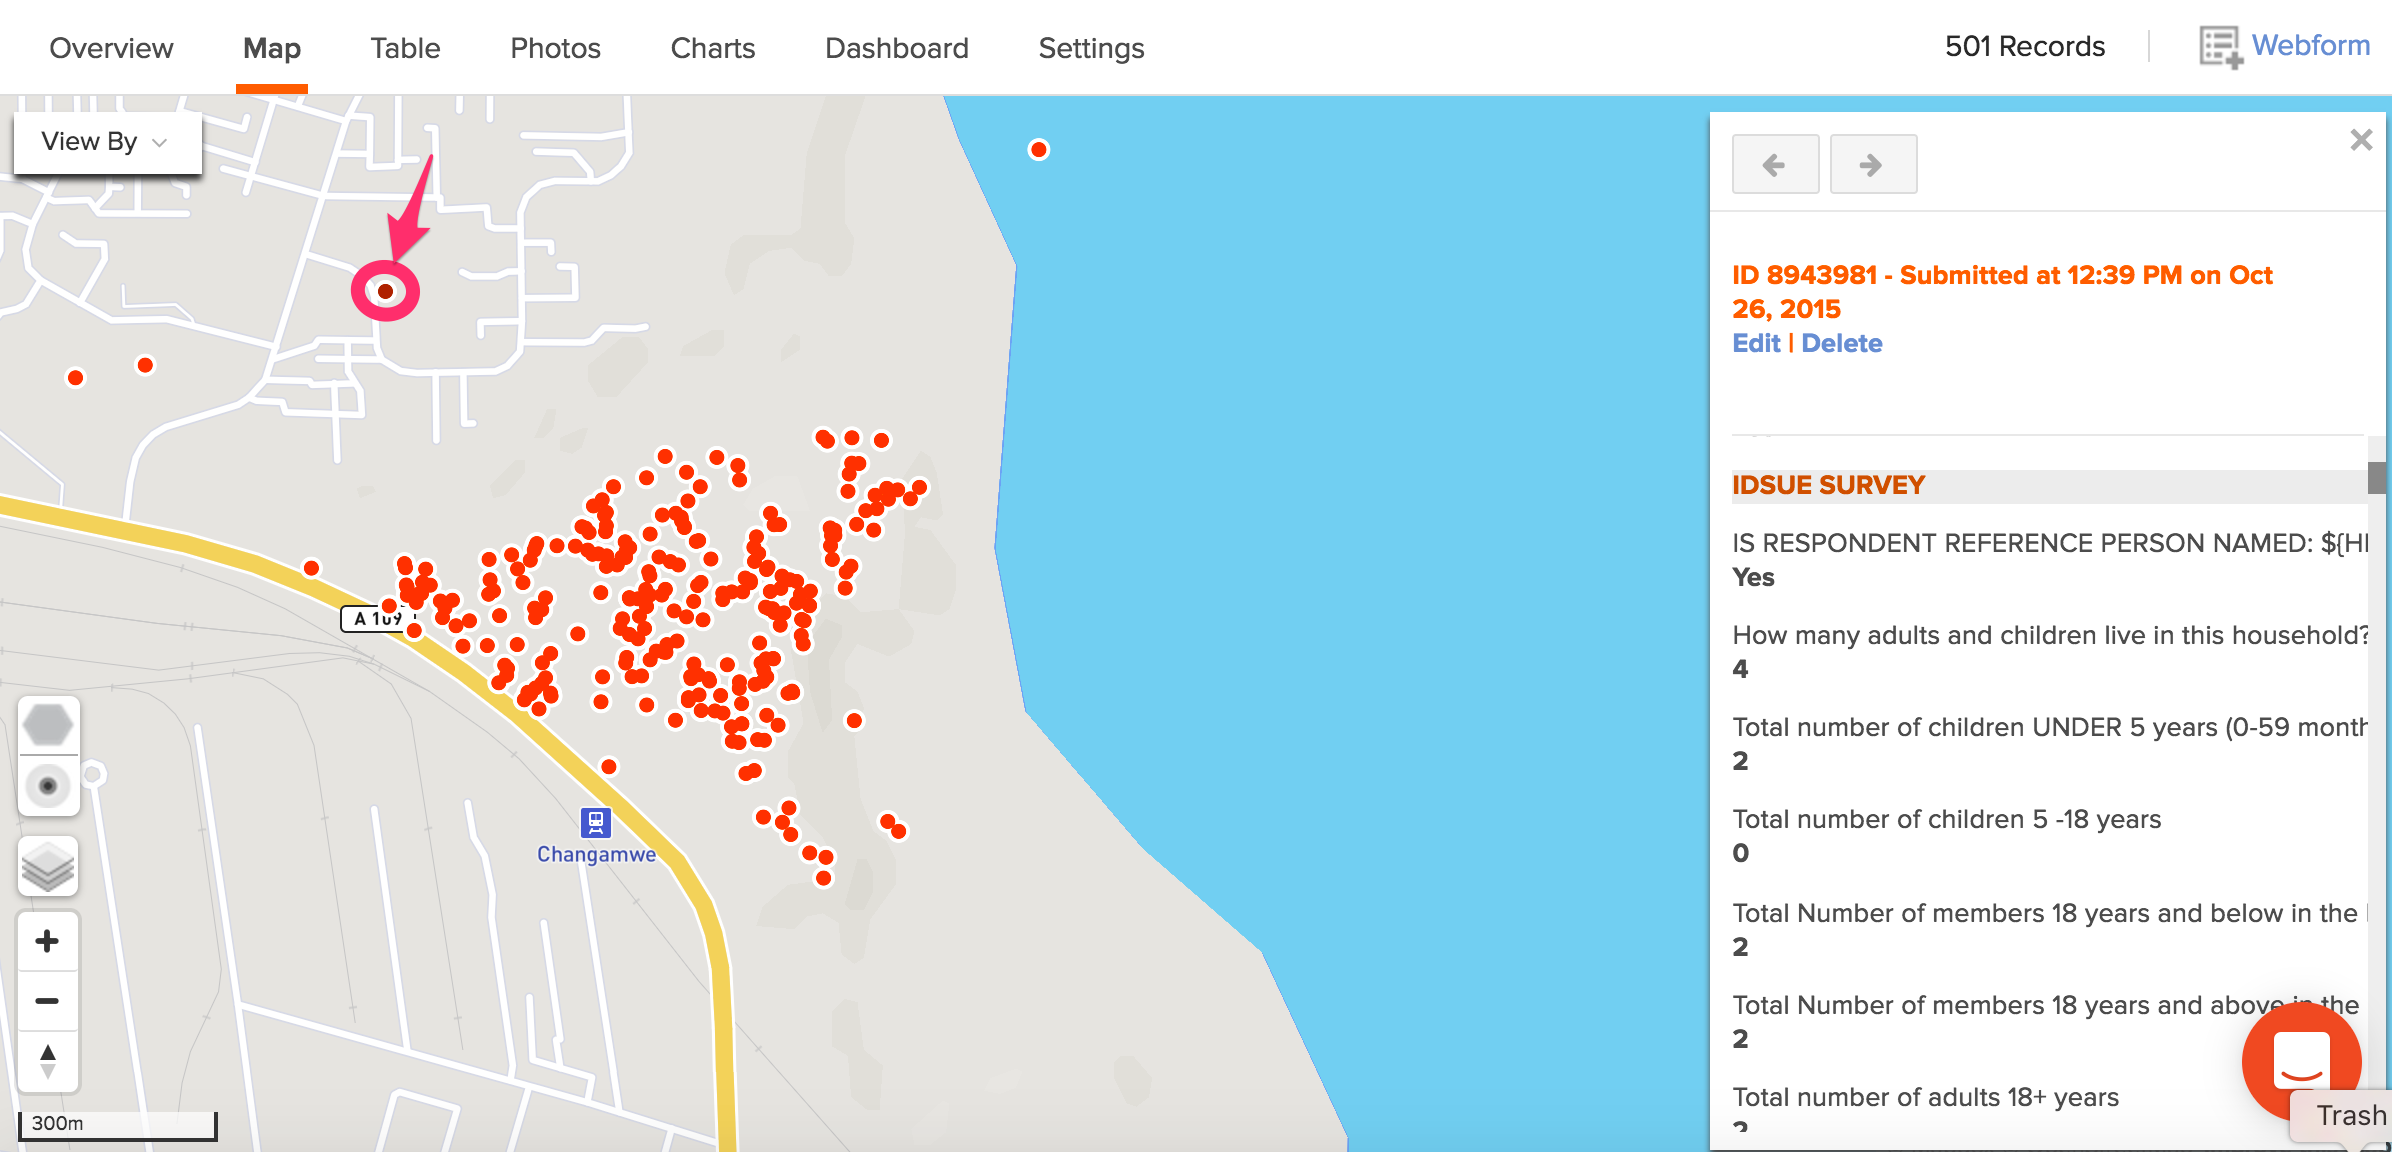
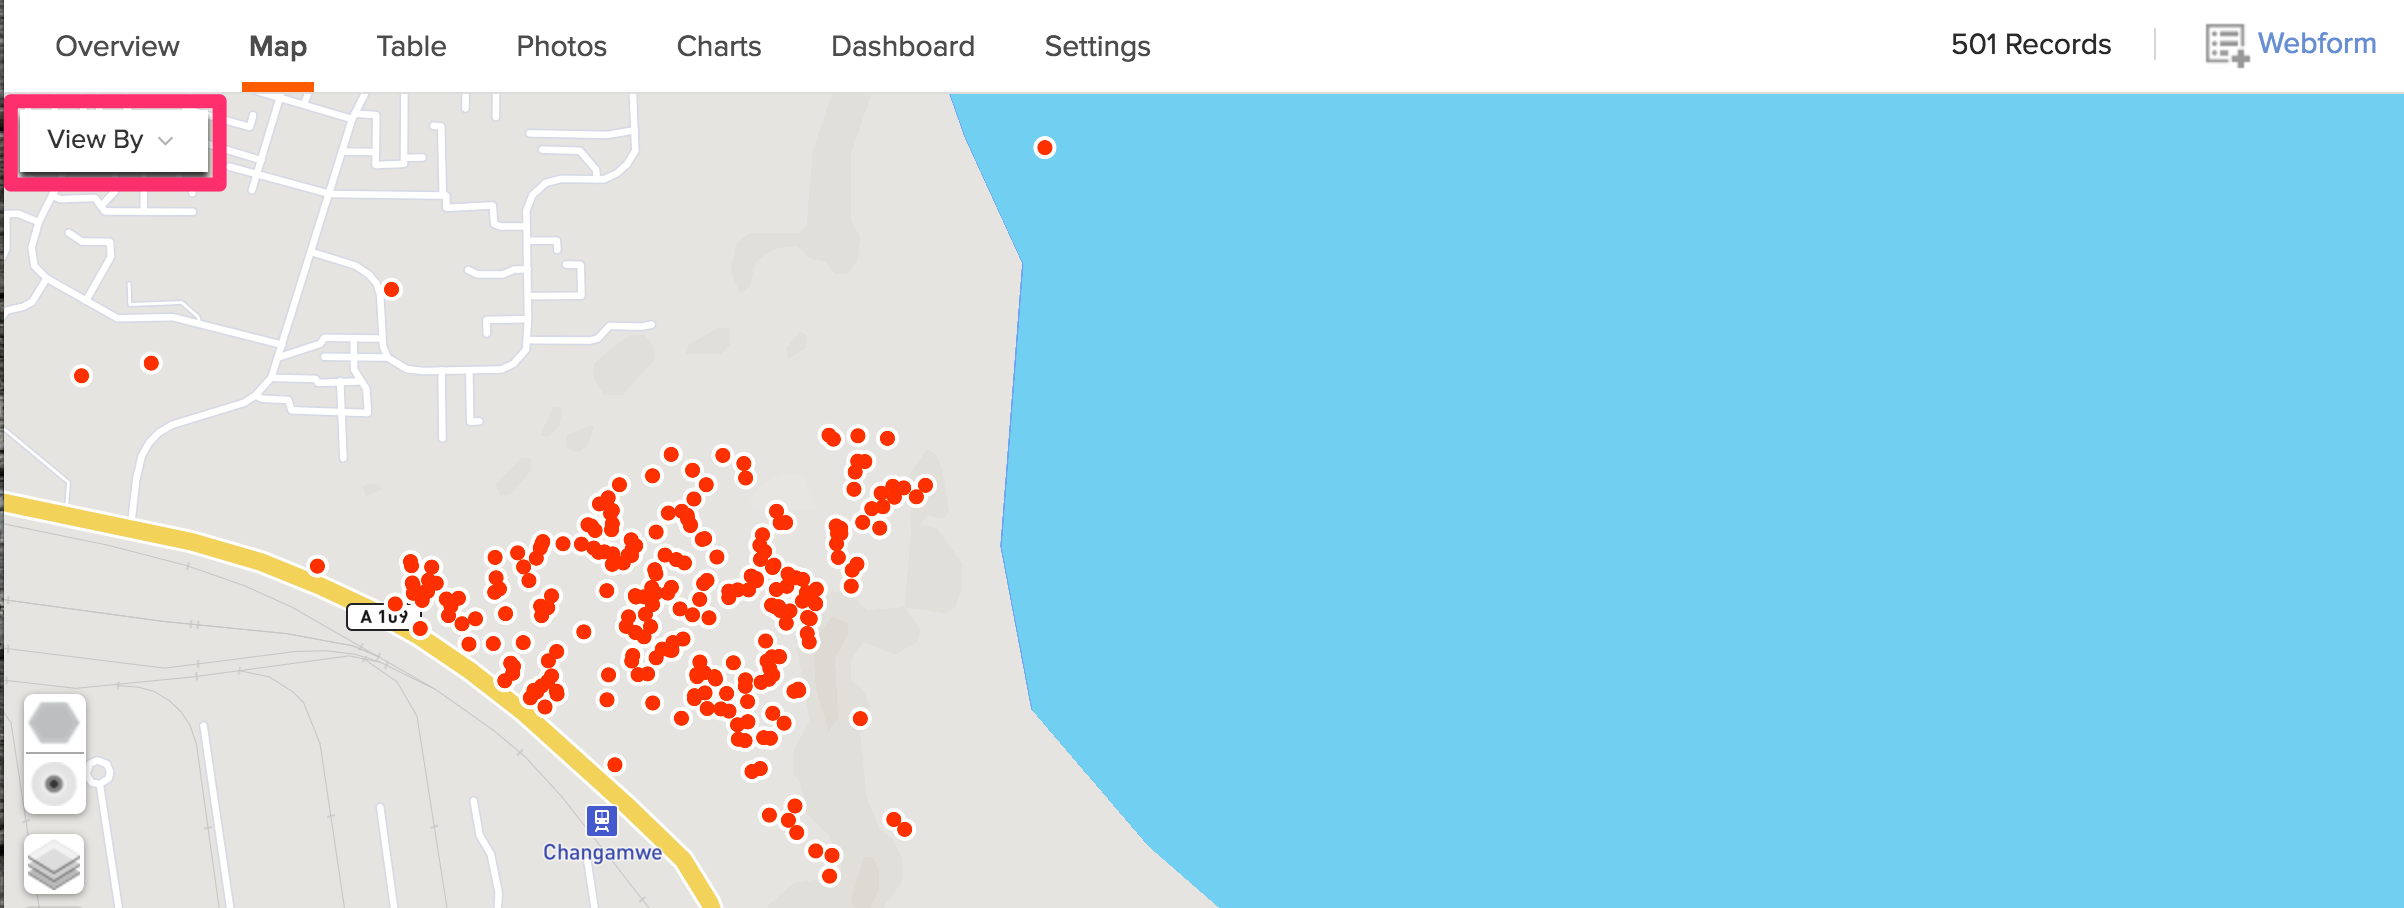
You can also filter points on a map based on specific answers by selecting the questions from the View by dropdown on the top left corner of the map.
Vector tiles
The map view has been improved by enabling support for vector tile maps. Vector tiles are smaller in size compared to raster tiles. This translates to higher resolution and improved performance allowing you to serve up larger datasets to maps. Have a look at this blog post for more information on the key benefits of vector tiles.
Layer button
The layer button on the Map view groups different map layers together.
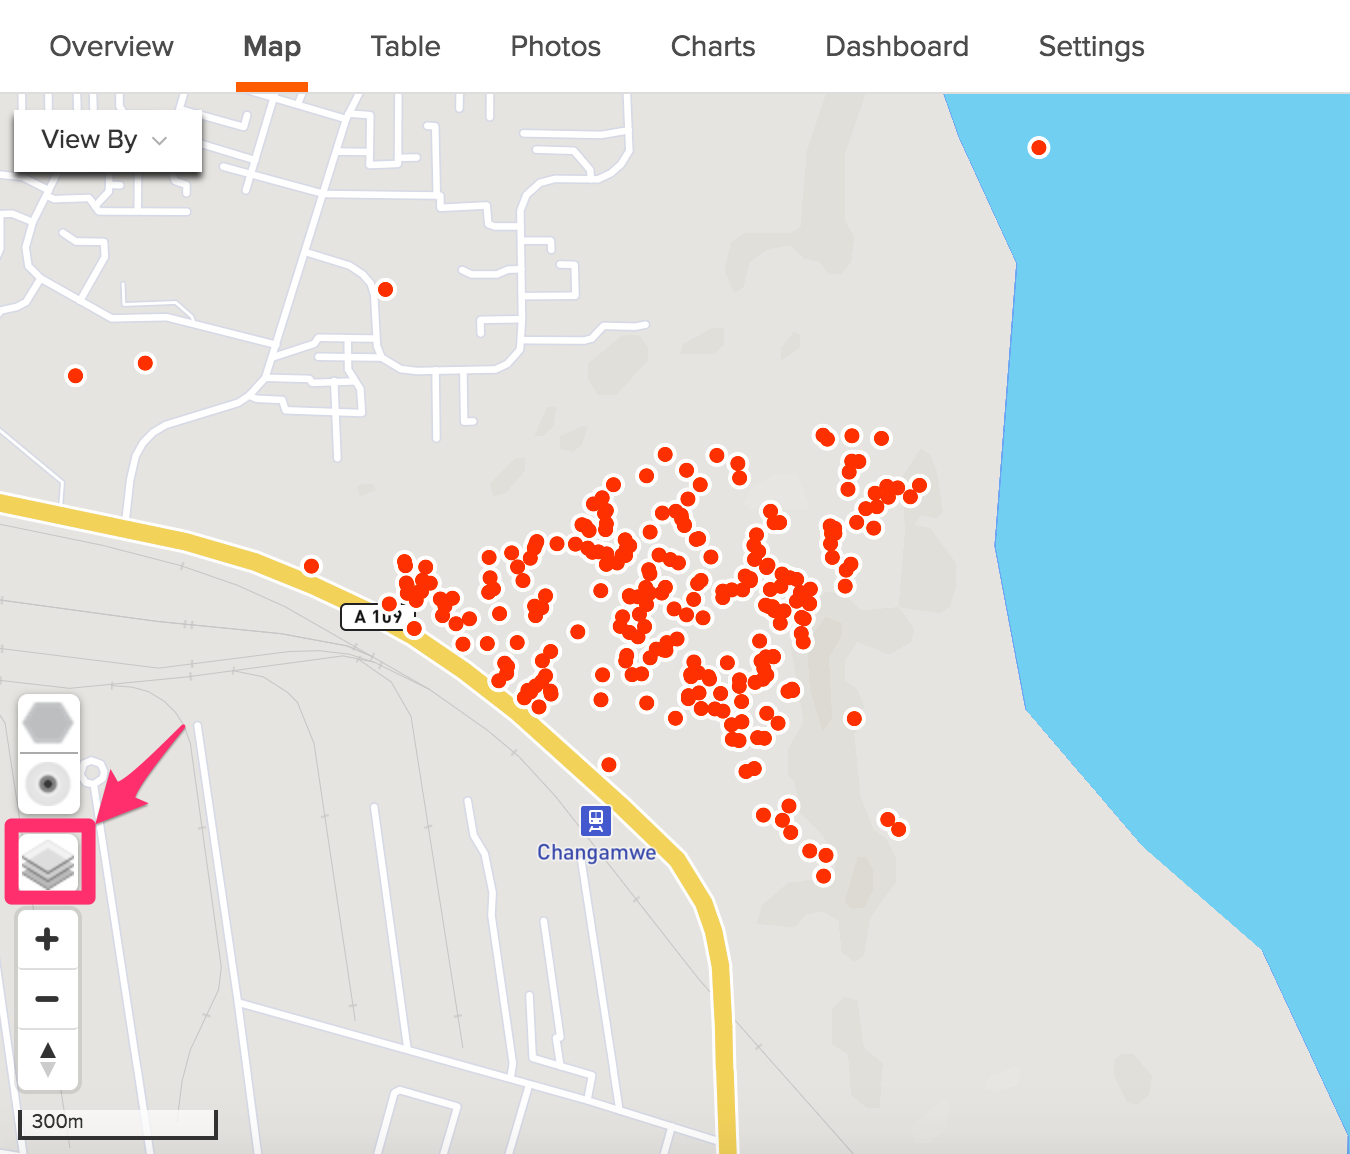
There are eight layer types supported on Ona. Each layer type references the dataset and defines how the data will be portrayed.
- Mapbox Basic – displays simple and flexible maps.
- Mapbox Outdoors – a terrain map with detailed elevation and landcover data.
- Mapbox Streets – a comprehensive general-purpose map that emphasizes accurate legible styling of road and transit networks.
- Mapbox Bright – renders complex custom base maps.
- Mapbox Light – provides geographic context while highlighting data on your dashboard.
- Mapbox Dark – renders the same geographic context as Mapbox Light.
- Mapbox Satellite – a global map of high-resolution imagery.
- Hi-Res Satellite (DigitalGlobe) – A global base map that offers the highest level of detail and accuracy.
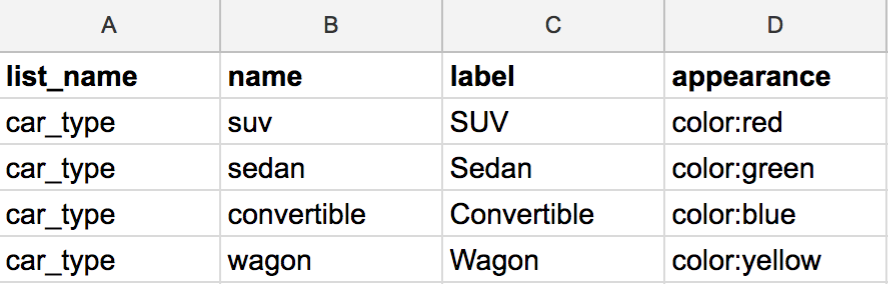
Adding colors to your Map
You can specify the colors for specific responses to data by assigning colors to specific categories (options) on the choices worksheet of your XLSForm. All you have to do is add an appearance column, then define the colors you want under this column, for instance color: blue.
Refer to this blog post for more information on how to add colors to your questions.
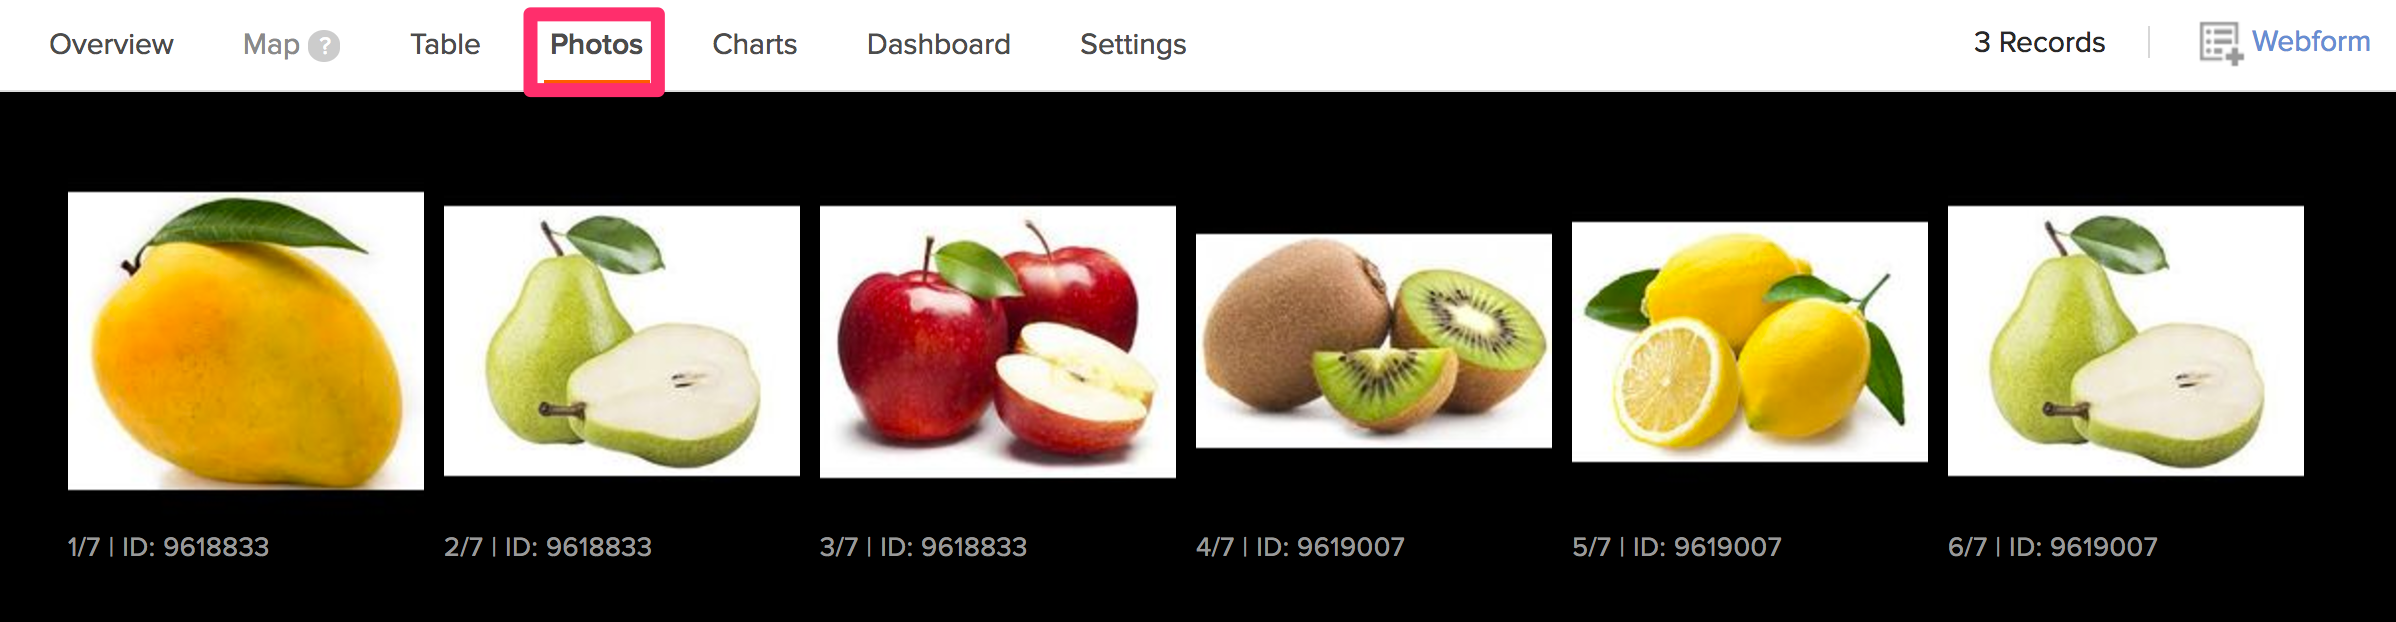
Photo View
You can view all the images uploaded with data in a photos gallery under the Photos tab.
Images can also be viewed online, on the Photos tab, by clicking on the image to open . When you click on the image link on the Table tab, the image downloads automatically and you can open the image locally.
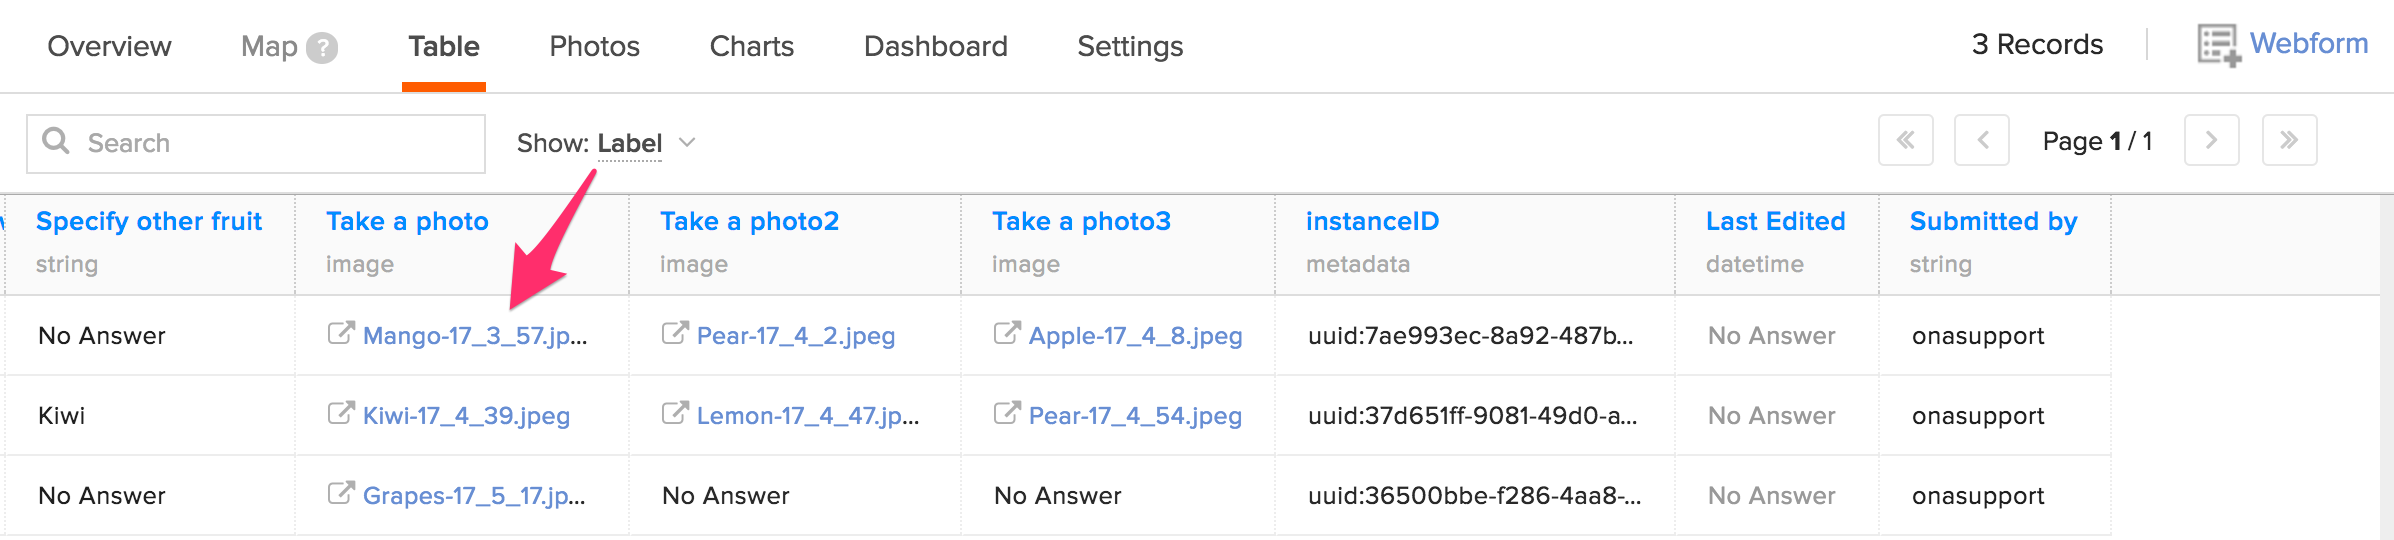
You can also click on the view icon on the Table tab to see the attached images.
Data Tables
The Table tab gives you an overview of submitted data. It’s on this page that you can search across submissions for specific records by typing variable names in the search tab.
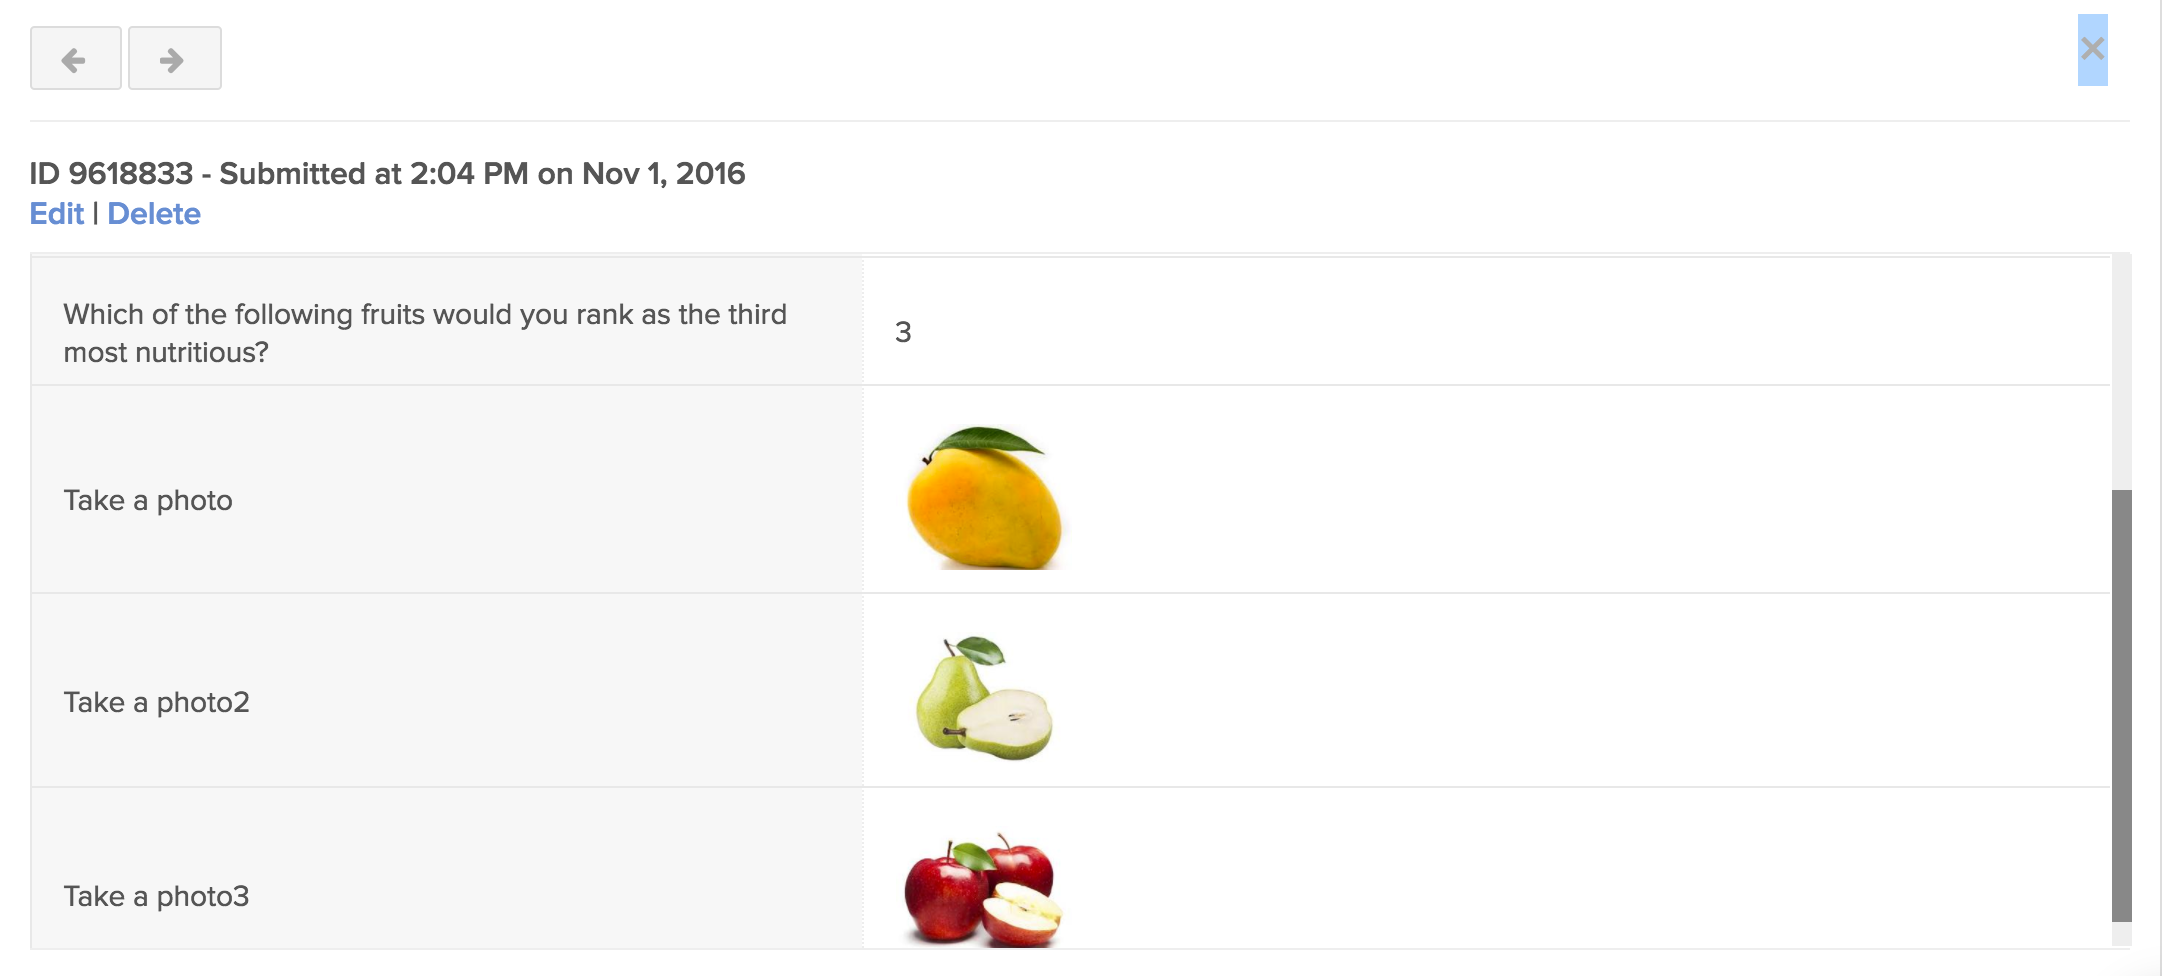
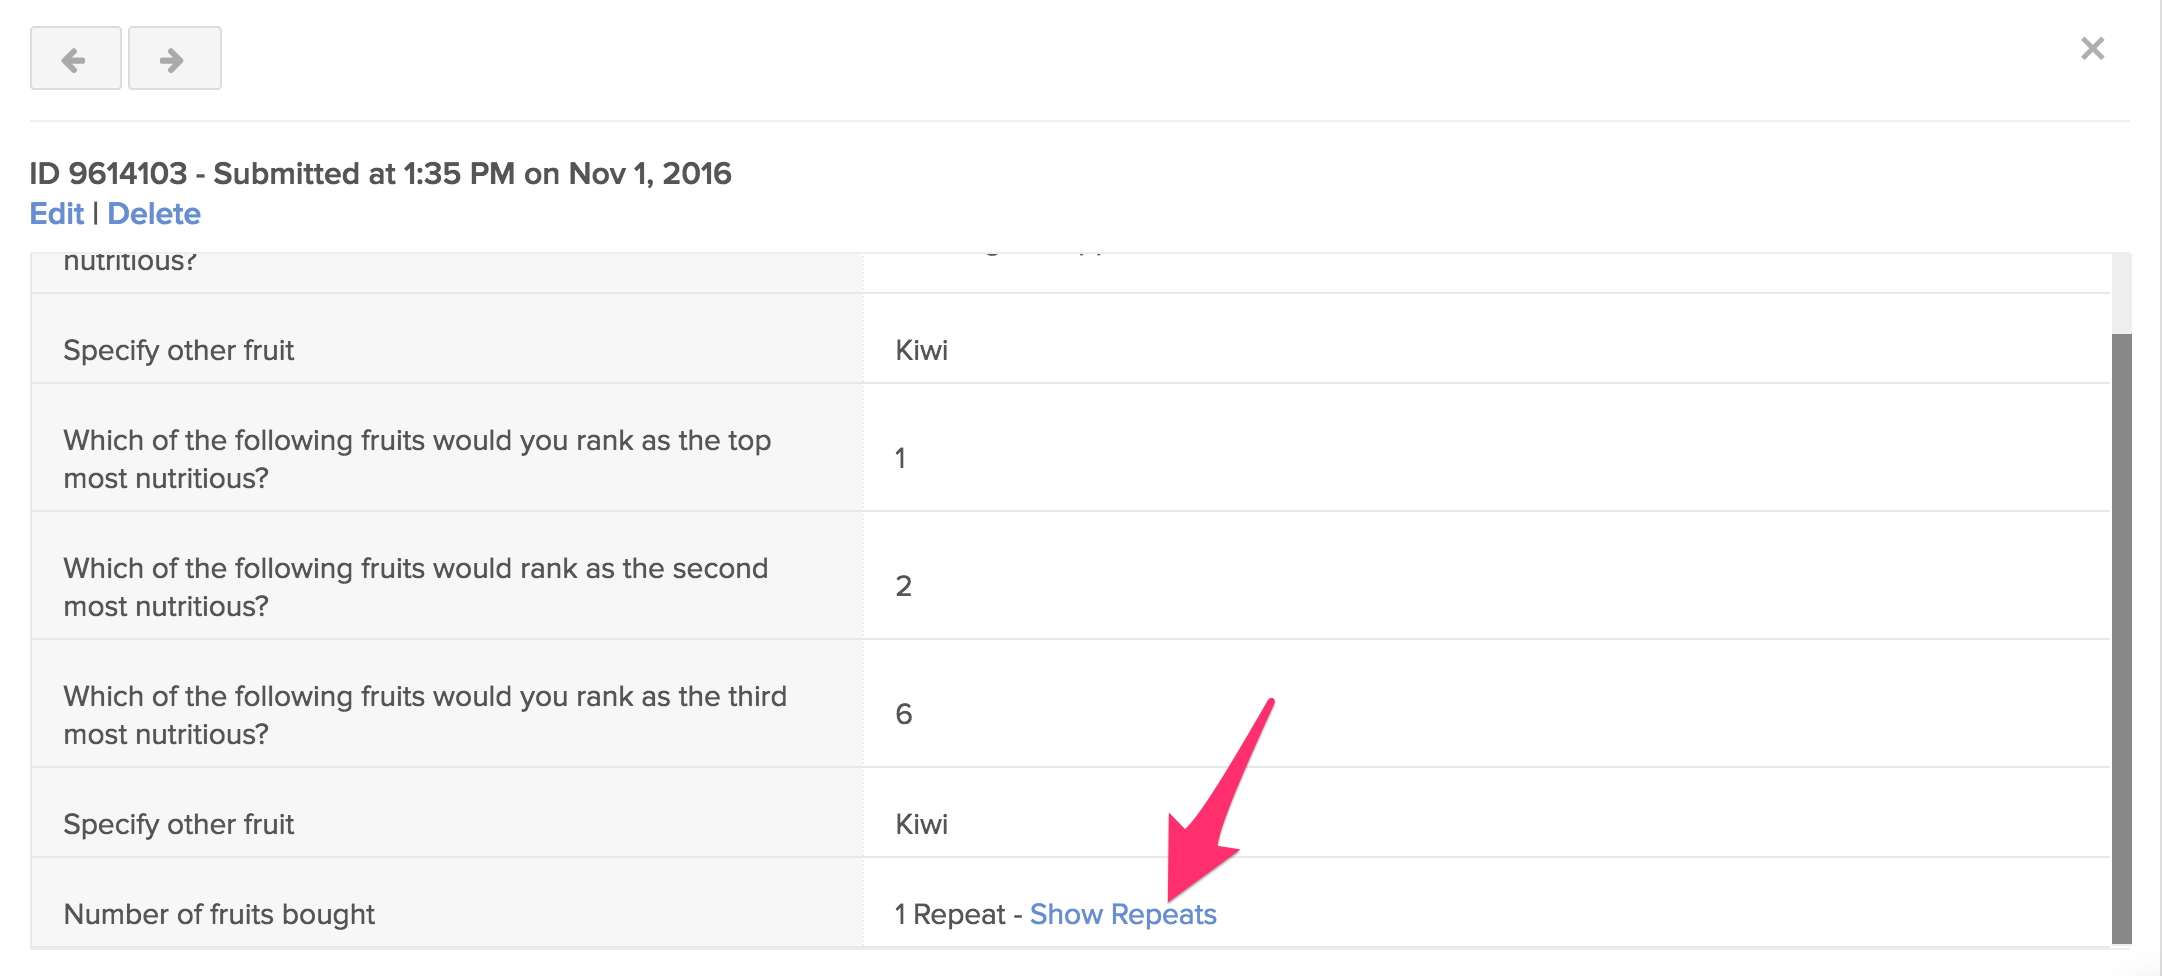
Repeat group data is usually not displayed on the table. To view data under repeat groups, click on the view icon of a single submission, then click on the Show Repeats link.
If your form is authored in multiple languages, you can view your data in a different language besides the default language by selecting a different one from the language dropdown menu. Please note that changing languages changes the data labels when you switch on labels from Show Label
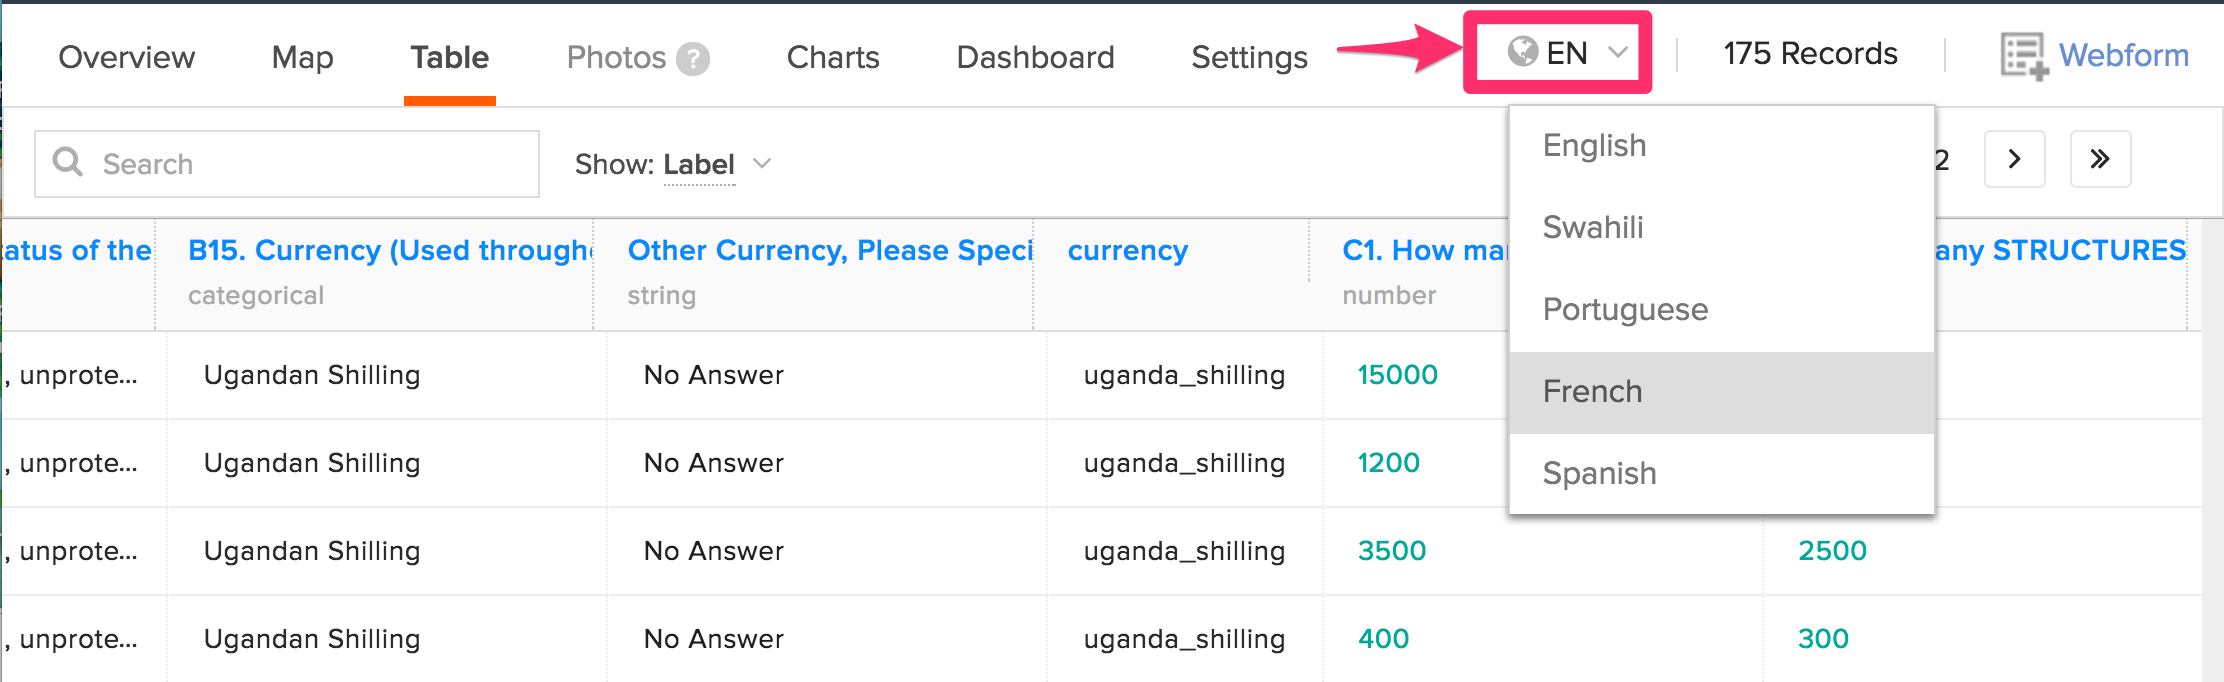
Refer to this guide for more information on multiple language forms.
Summary Charts
Charts enable you to perform summary statistical analysis on your data by creating bar graphs and pie charts.
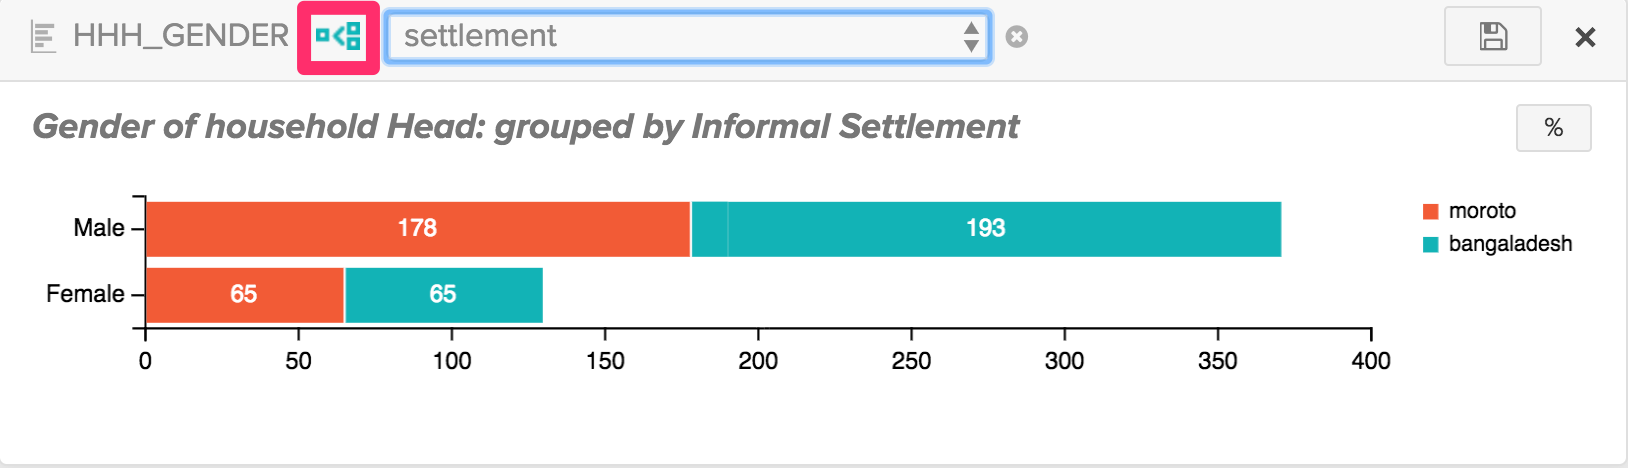
You can do simple disaggregation by variables on graphs using the Aggregate icon next to the chart title.
Note:
You can only disaggregate charts by a select one question type.
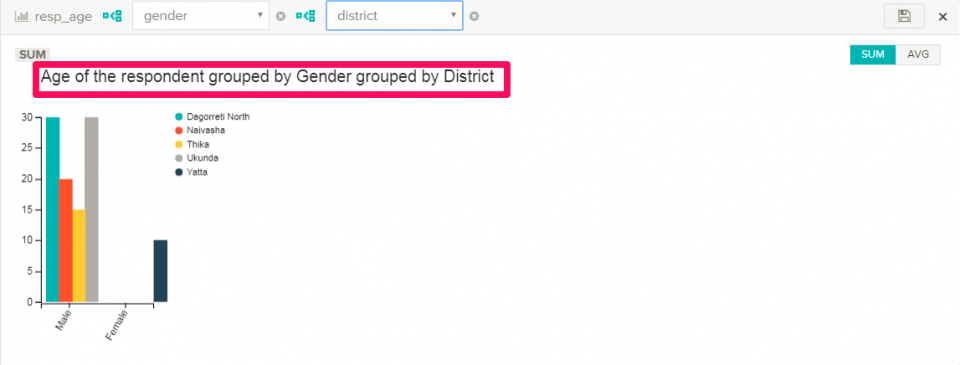
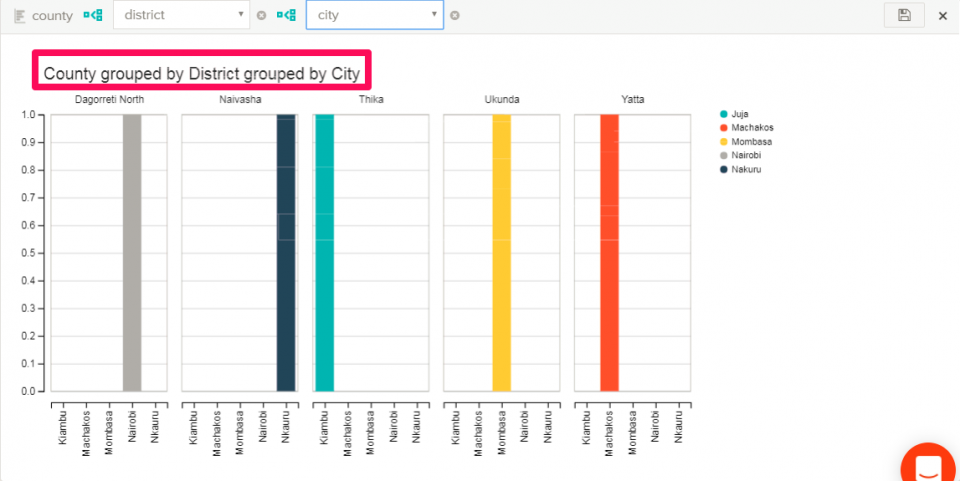
You can view three dimensions on a chart by grouping a numeric chart with two categorical variables. For example, you can have age (integer) grouped by district (category) grouped by gender (category).
You can also group a non-numeric chart with two categorical variables. For example, you can have county (category) grouped by district (category) grouped by city (category).
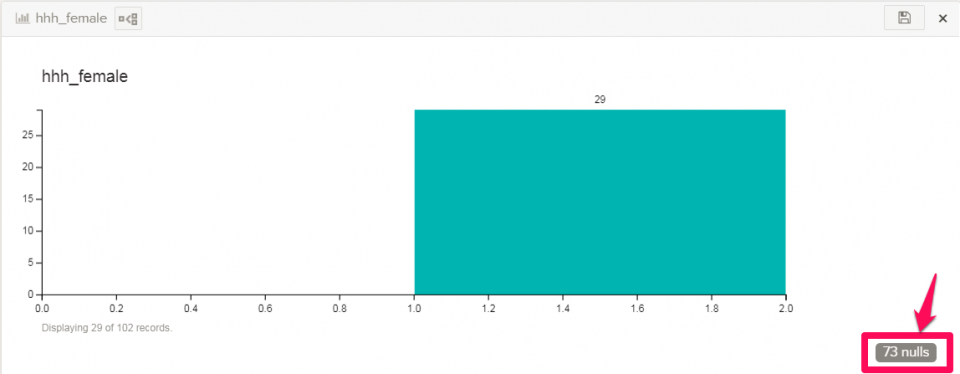
Toggle null answers on and off the charts by clicking on the null toggle button to show or hide null values in the chart visualization area.
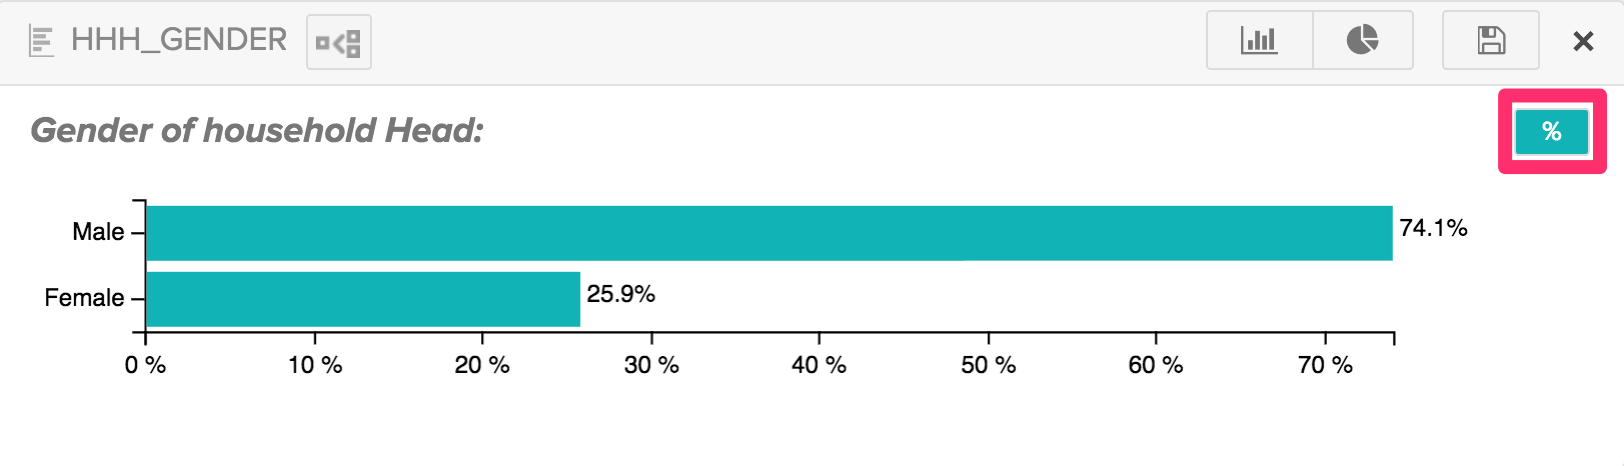
You can get the percentages on the category data for select_one questions by clicking on the percentage button.
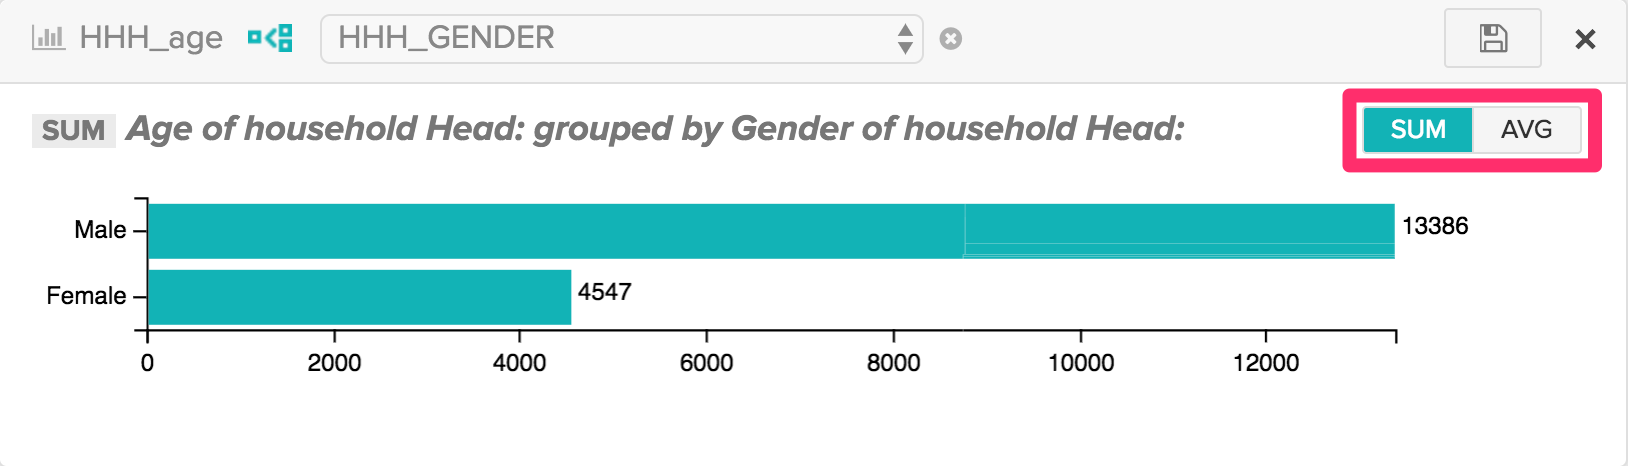
Grouping a numeric variable by a select_one question allows you to get the sum and averages of category data. To get the values, click on either value on the SUM/AVG toggle button.
You can save charts to a dashboard for future reference or even download them. Charts are downloaded in .png format. Click on the save icon to save a chart to the dashboard or download it. You can save the dashboard when using both public and private projects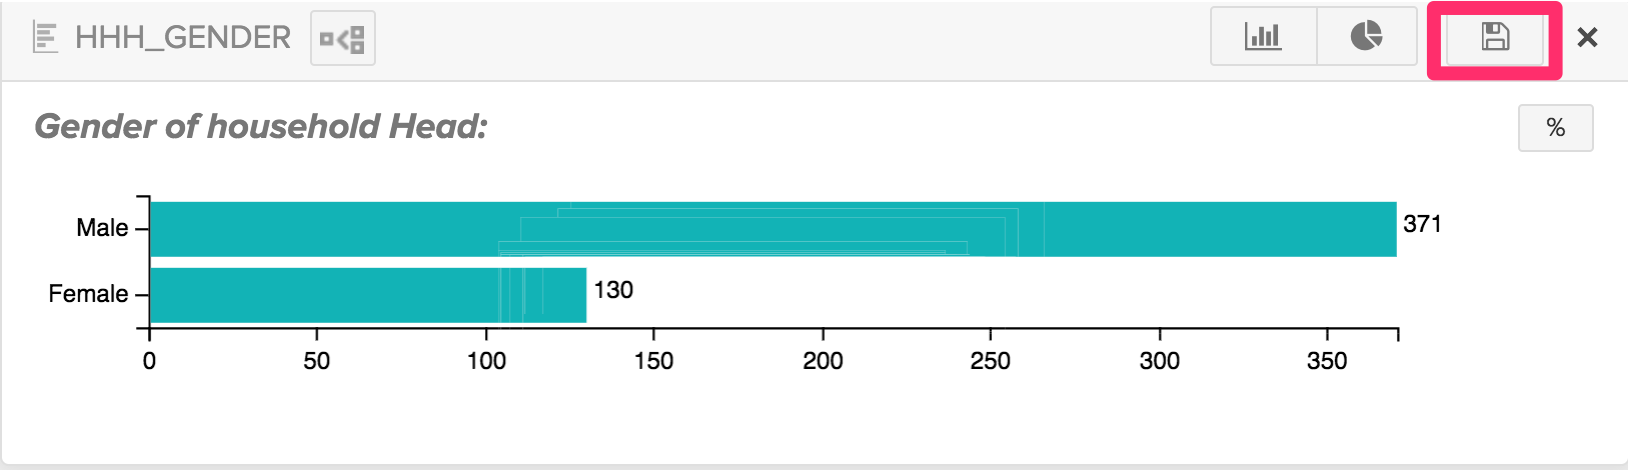
Note:
Saving charts to the dashboard is an advanced feature which is included in the paid plans.
Editing Chart Titles
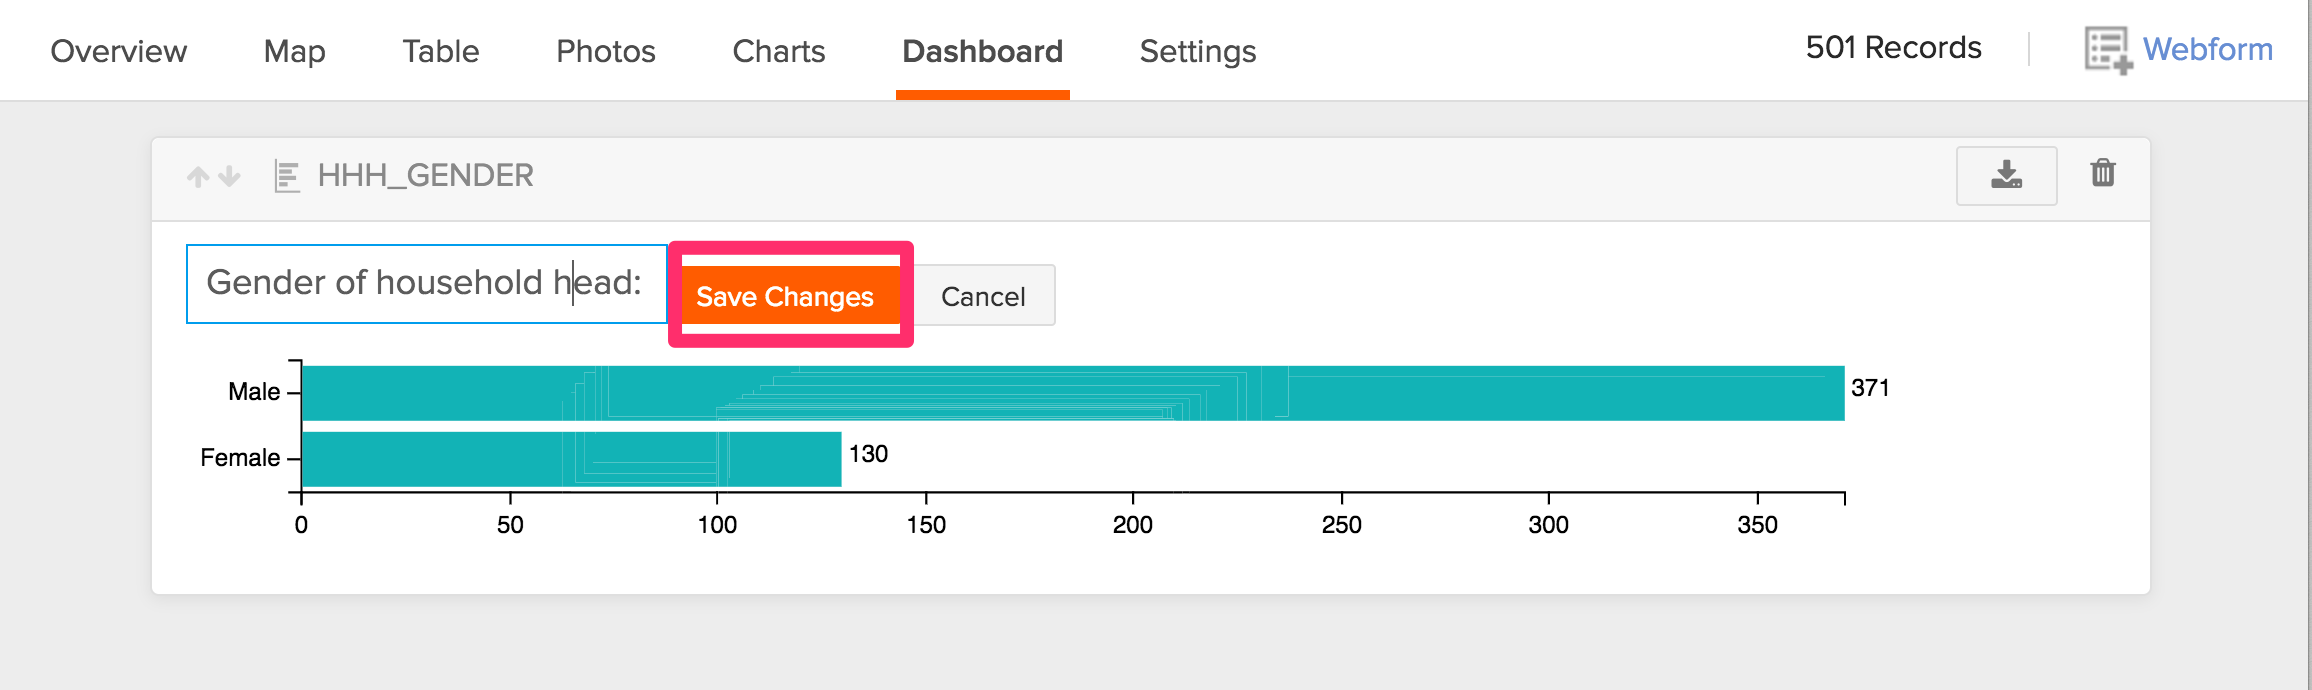
Chart titles are editable from the dashboard. To edit a chart title, save it to the dashboard, then click on the pencil icon.

This opens a text box where you can type in the new title. Once done, click on Save Changes to save the new chart title.
However, not all users can save and edit charts. Below are the permission levels supported for both saving charts and editing chart title features;
| Can view | Can view and download | Can submit | Can Edit | Is admin | |
| Can save charts to the dashboard | x | x | x | x | |
| Can edit chart title | x | x | x |
Exporting Data
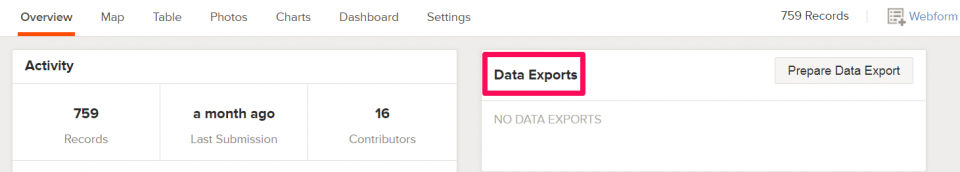
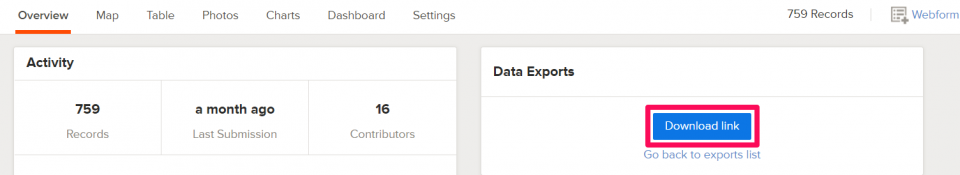
You can export data under the Data Exports section of the form’s Overview page.
Click Prepare Data Export for new data export.
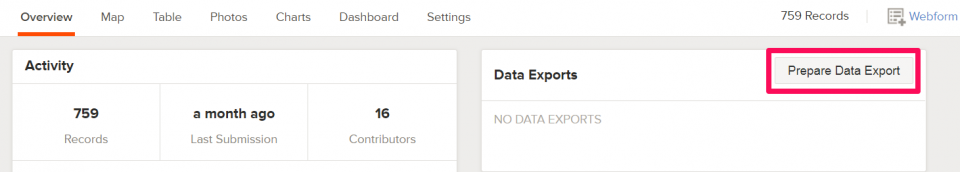
New data exports are generated either when new submissions exist or you change parameters of the export changes; otherwise, a link to an existing export is provided instantly hence saving you time.
Previous exports are saved on the Data Exports panel. The first page of the exports panel displays the last 5 data exports of a form that has multiple data exports generated. You can view the other exports by clicking on the forward button.
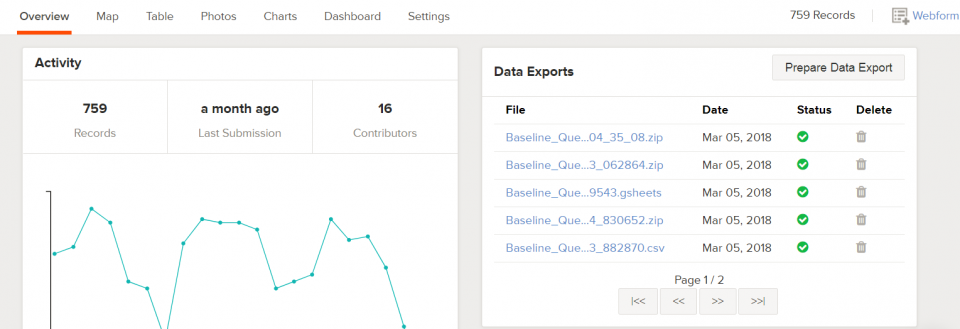
The following details are displayed alongside each export:
- The File with a hyperlink to download the export.
- Date the export was created
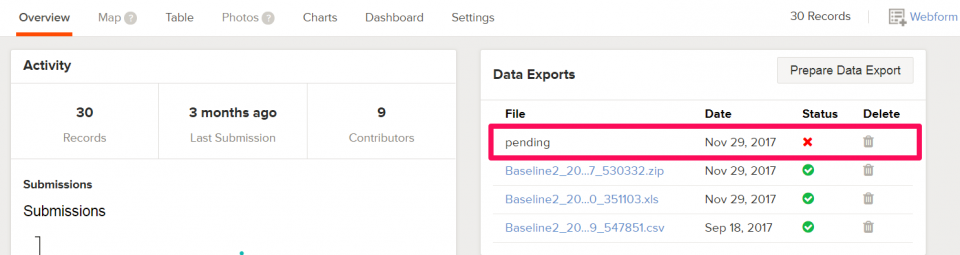
- Status of the export: complete, pending, or failed.
- Delete icon.
You can delete timed-out or failed exports by clicking on the Delete icon. Only users with an Admin role can delete exports from the Data Exports panel.
You can export data in different formats in the Export Data section. Each format is explained in detail under the export formats section.
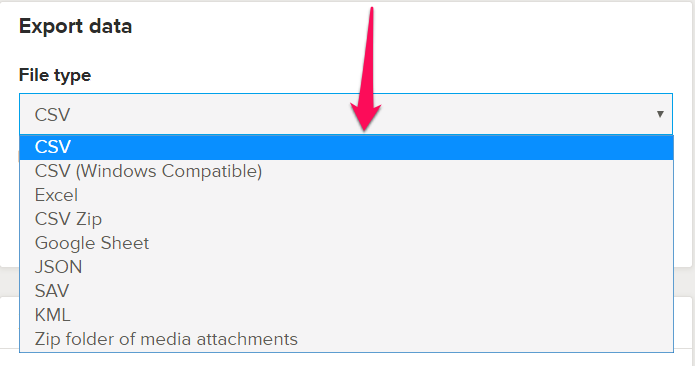
Export Formats
CSV(comma separated values)
All data is exported in one worksheet with each column following the order of the questionnaire.
CSV (Windows Compatible)
This works in a similar way as CSV exports, with the only difference being that it supports encoding of CSV exports on Windows.
Excel(formatted spreadsheet)
Allows you to export data in xlsx format. For repeat groups data, each repeat group is exported in a different worksheet but uniquely indexed to the appropriate parent unit of observation.
CSV Zip
With this format, you can export your data in a zipped folder. Data is exported in the same format as CSV exports.
Google Sheet
Google Sheets integration allows you to sync your data directly from your form in Ona to a spreadsheet in Google Sheets. You can learn more about Google Sheets exports from this guide.
Note:
Google Sheets exports is an advanced feature which is included with the paid plans.
JSON
Exports your data in a JSON file. The JSON file should be opened in a text editor e.g Brackets to view the downloaded data.
SAV
SAV exports are compatible with the SPSS packages. With SAV exports, you can view choice labels upon opening the file on SPSS.
Repeat groups data is also exported with each repeat group in a different worksheet but uniquely indexed to the appropriate parent unit of observation.
KML
KML stands for Keyhole Markup Language. This format allows you to export all the GPS points collected in one file. Downloaded KML files are primarily opened with the Google Earth application which has to be installed on your computer.
Zip folder of media attachments
Media files in your data can be downloaded in bulk as a zipped folder using this format. Read more on media files export on this faq.
Advanced export options
In addition to the above export formats, you can also use Advanced export options when exporting your data to include or exclude some parameters.
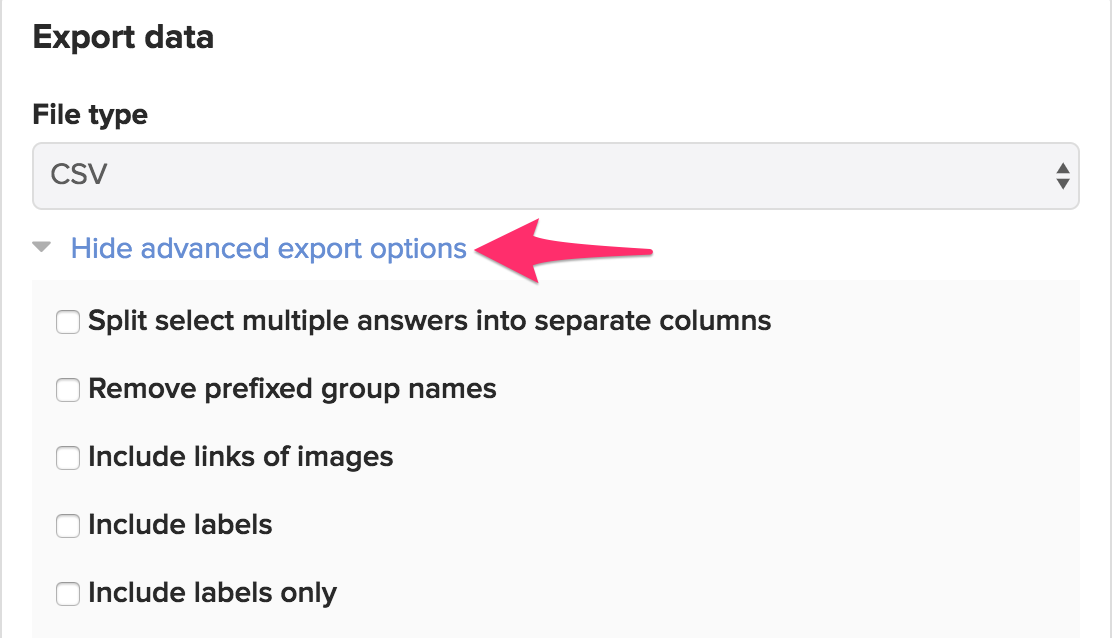
Split select multiple answers into separate columns
You can opt to split multiple answer choices into separate columns by checking this check box. Leaving this check box unchecked, exports multiple answer choices in one column separated by a space.
This option is preferable when uploading your data back using the Import CSV feature. When a dataset with split multiple answers is imported, the multiple answers are normally hidden.
Remove prefixed group names
When this option is selected, it exports your data without the group names.
Include links to images
This option downloads the image files with links to the filenames of the media attachments but not the files themselves. You can click on the links to view the images online.
With the checkbox unchecked, only the image filenames are downloaded, which are not viewable.
Include labels
When this option is selected, it allows you to download your data with both field names and labels.
Include labels only
This option downloads your data with the labels only.
Export with choice labels
When this option is selected, it exports data with choice labels from multiple-choice questions instead of the choice name values. When you have data from a multiple-choice question where more than one answer is possible, you will need to select Export with Choice Labels. When you have data from a multiple-choice question where only one answer is possible, the same as select multiple you need to select one option, Export with Choice Labels.
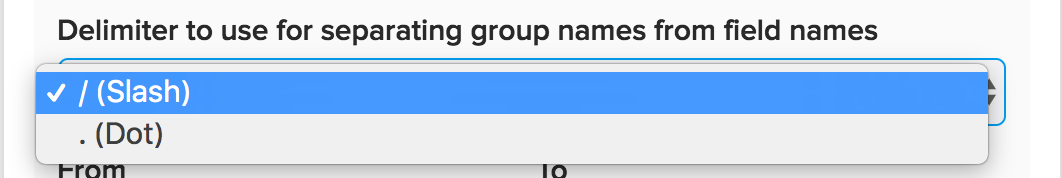
Delimiter to use for separating group names from field names
You can choose the delimiter for separating group names from field names under this drop-down. There are two options that are currently supported, the Slash(/) and Dot(.).
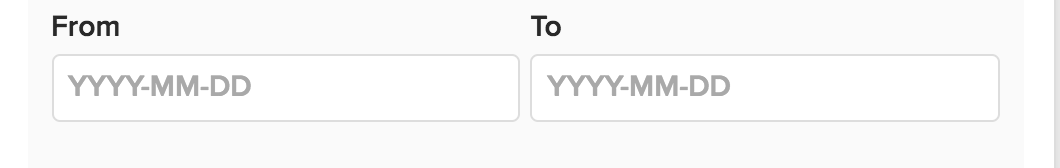
Date Range
You can download data within a specific date range by entering the dates in the From and To fields. The dates specified are the submission dates.
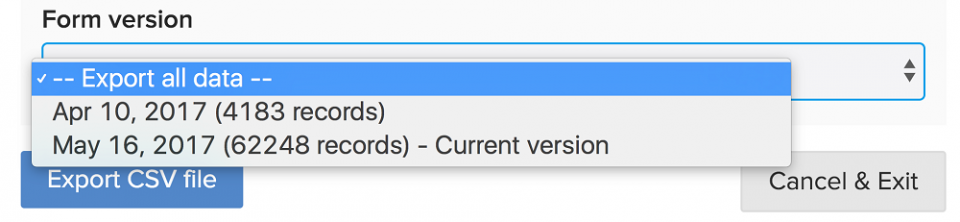
Form version
After a new form has been uploaded, any form replacement is considered a new version of the form. All versions of the form will be displayed with the date they were uploaded and the number of records associated with that form version. The current form version is noted. You can also choose to export all the data by clicking –Export all data–.
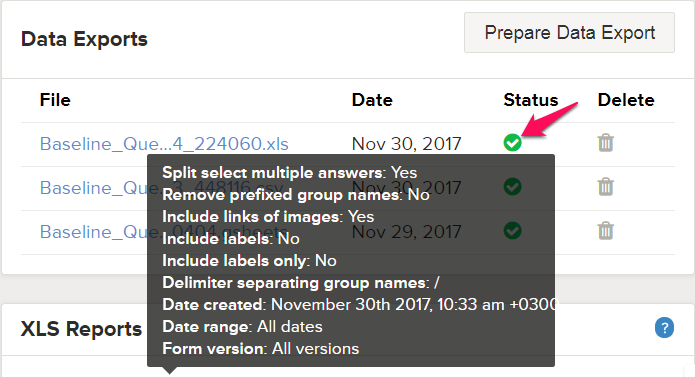
Once the export has been generated, you can view which advanced options were selected for the export by hovering the mouse over the Status icon. The date range and form version are also included in the list.
Caveat on exporting data for a form that was replaced
When a form is replaced, the previous form version is overwritten by the new form version with the changes included in the new form. No data is lost, but the changes incorporated in the updated form hide data for deleted fields and fields whose variable names have been altered.
Replacing a form with submissions creates different form versions after each form replacement.
When exporting data from a form that has been replaced, you can only download data using fields in the current form version and not fields in all the form versions. This is due to the fact that different form versions could be radically different making it difficult to unify them into a single export.
Metadata Fields
There are several metadata fields that are added to the dataset when data is uploaded to Ona. These fields include;
- Instance ID – this is a universal unique identifier that’s automatically generated once a submission has been finalized.
- _submission_time – time recorded when a submission has been uploaded to the server
- _tags – a metadata field that gives more information about the format specifications of your data. If no tag has been specified in the XLSForm, then this column is normally blank.
- _version – a value used for version control of the form. The recommended format is year/month/day
- _duration – this renders the total time taken from when a survey starts to when it ends. This value is only captured if both start and end metadata fields have been included in the XLSForm.
- _submitted_by – shows the username of a project collaborator who is assigned Can submit or a higher permission level on a project.
XLS Reports
Custom XLS Reports are a helpful analytics service from Ona. Ona users can access a beautiful Excel™ report with customized metrics and indicators, updated with the latest data. Read more on how to create XLS Reports in this faq
Managing Data
Editing and Cleaning Submitted Data
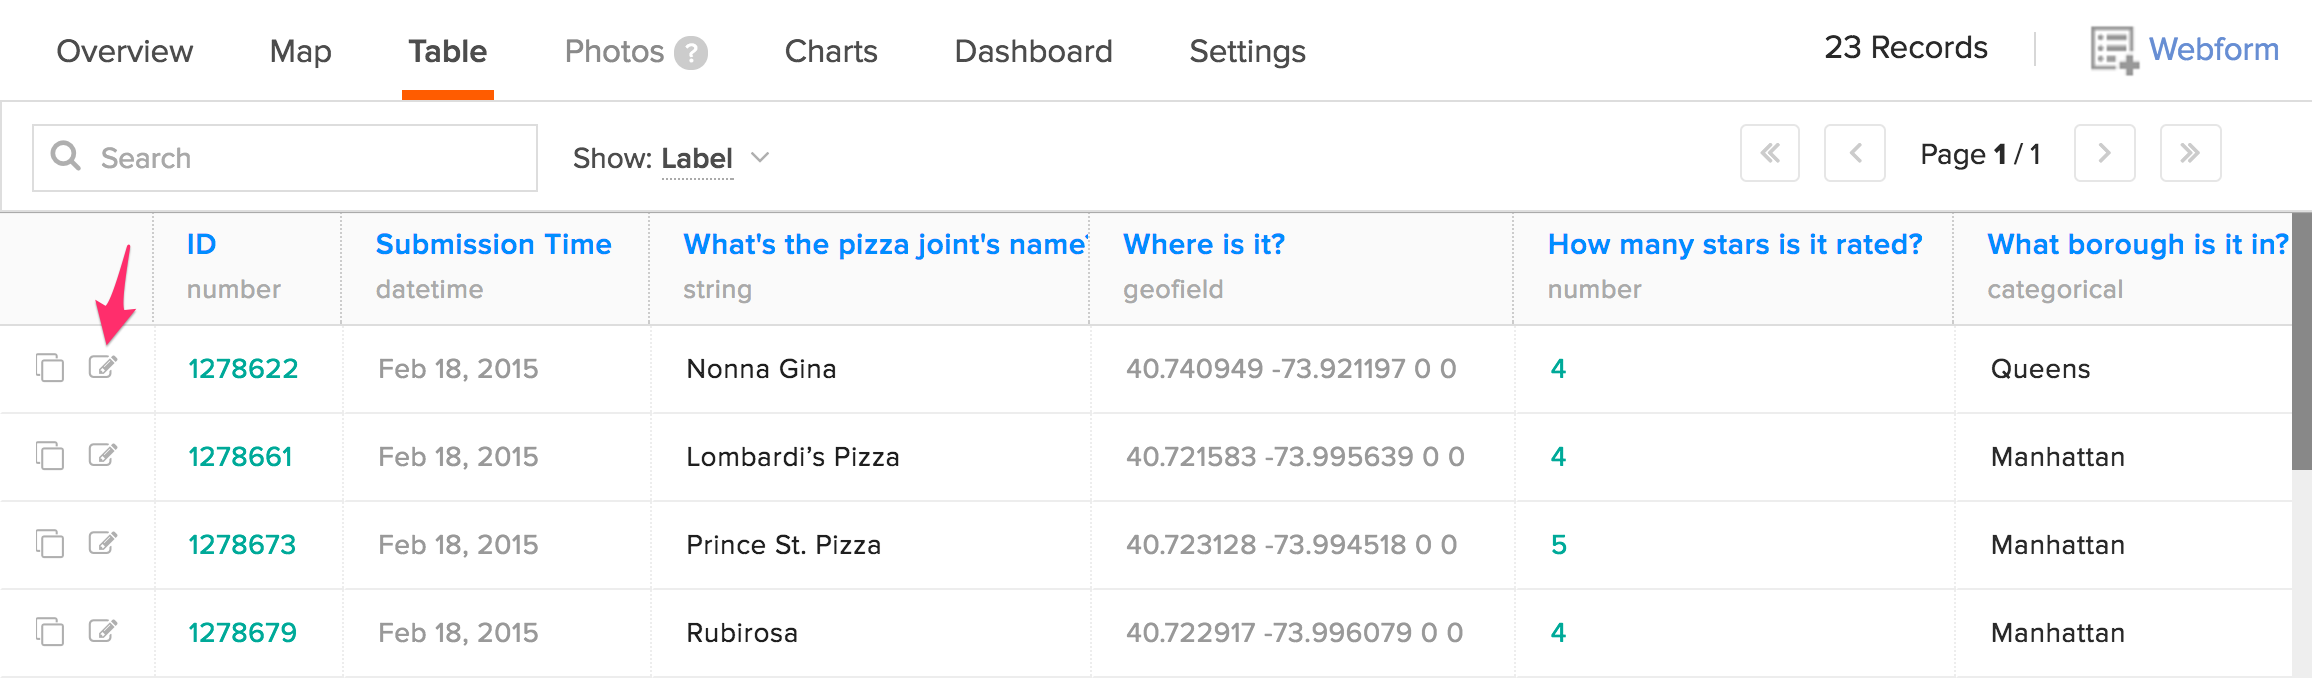
Submitted data can be edited online from the Table tab. Currently, bulk editing of submissions is not supported, hence you can only edit a single submission at a time.
To edit data, click on the edit icon in the first column on the left side of a record.
This opens the record in Enketo where you can make edits to your data. Once done editing your data, click on the Submit button to submit the changes.
You can view the changes made to the record by reloading the page. All the edits show up in the Table tab.
Note: Edited records cannot be searched using the uuid as this field changes after a record is edited. You should search for the records using the _id column field.
Sharing Data
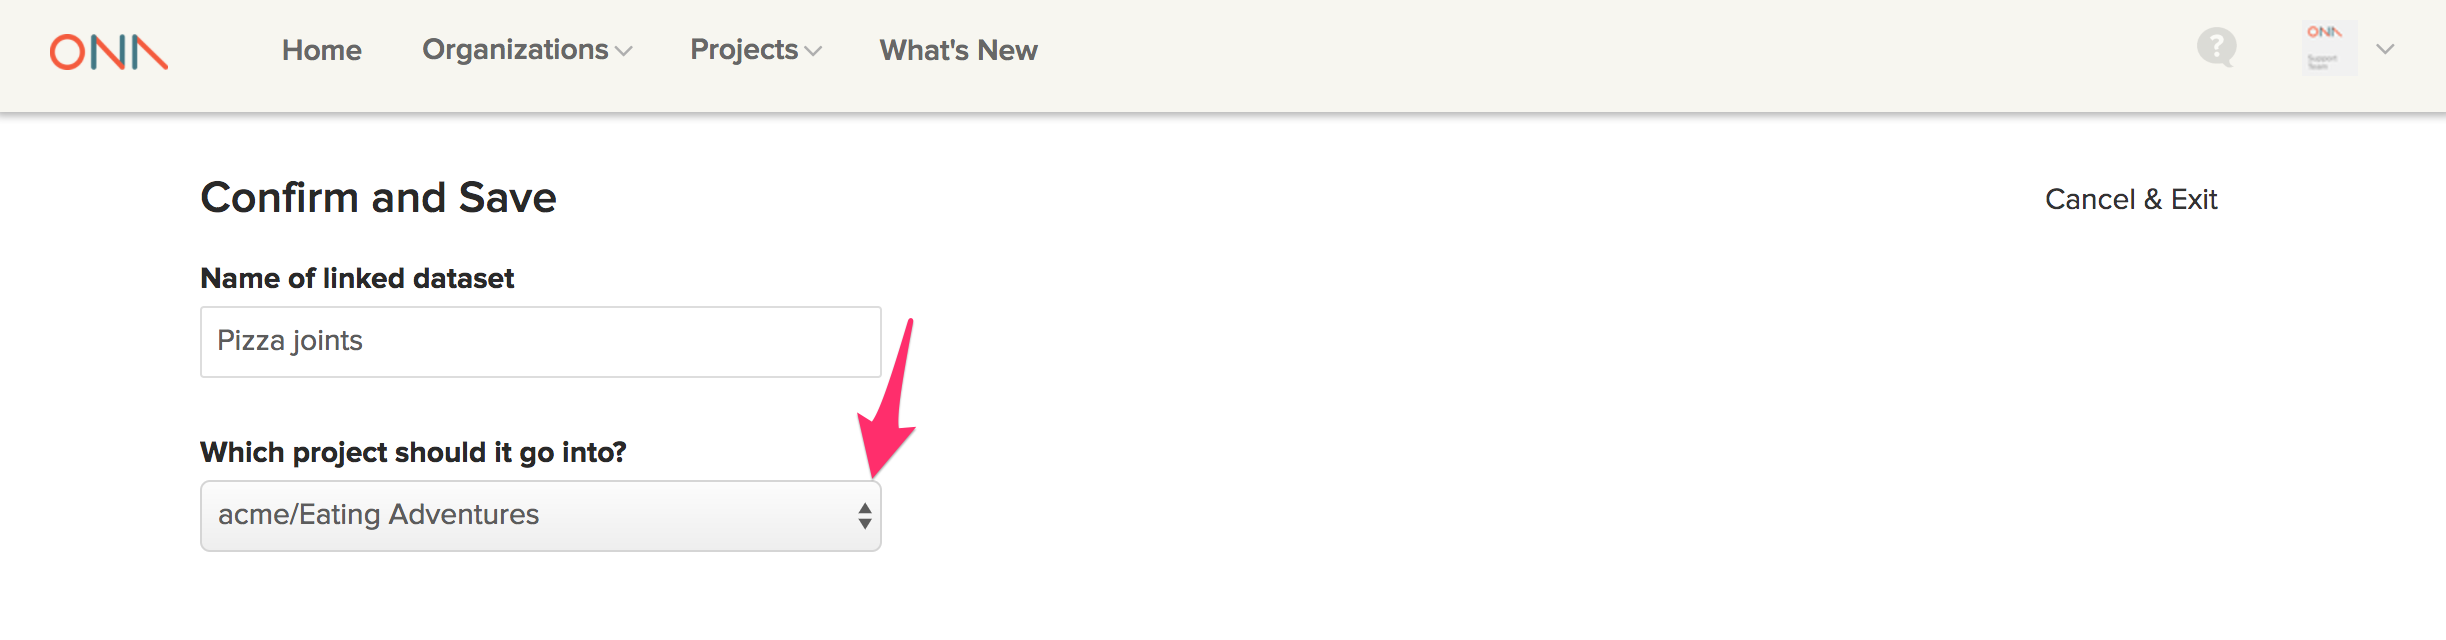
You can share submitted data by creating filtered datasets including only the fields that you would like to share with other users. You can achieve this by saving the filtered datasets in different projects owned by other users other than in the project where the form is.
Deleting form data/submissions
You can delete unwanted data from the Table tab. You can delete multiple records or just one record at a time. Only users with Admin/Can Edit permission levels can delete form submissions.
Deleting multiple records
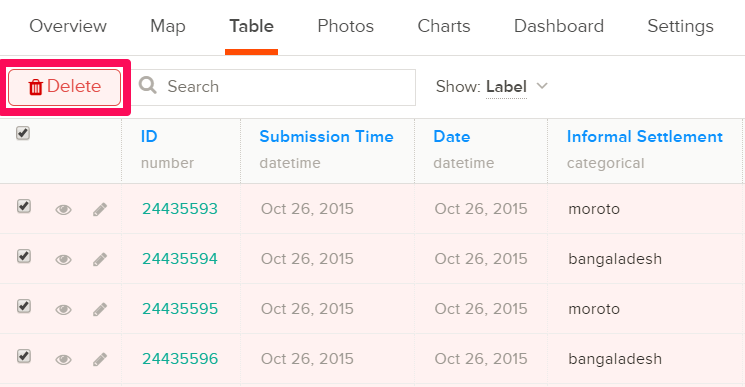
To delete all records on the current page, click on the check box that is on the left side of the column headers to select all records (shown in the image below), then click on the Delete button.
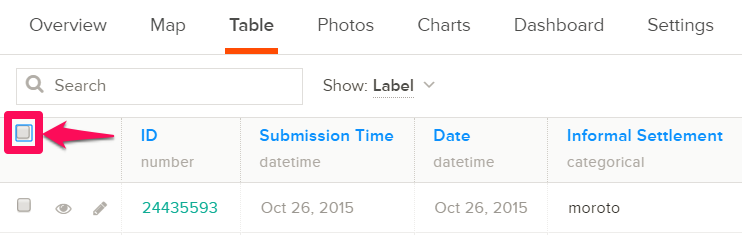
The Delete button appears only after records have been selected for deletion.
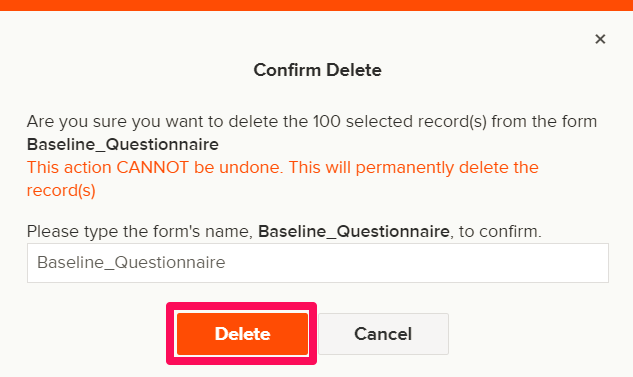
Clicking the Delete button opens the Confirm Delete modal, where you are prompted to type the form’s name to confirm the deletion of selected records. Click the Delete button after typing the form’s name to delete records from the Table tab.
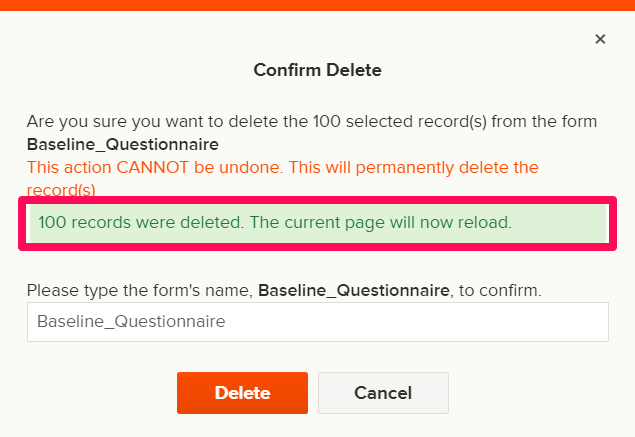
Once you confirm the deletion of the records, a message appears in the modal telling you how many records were deleted. The current page reloads after records have been deleted.
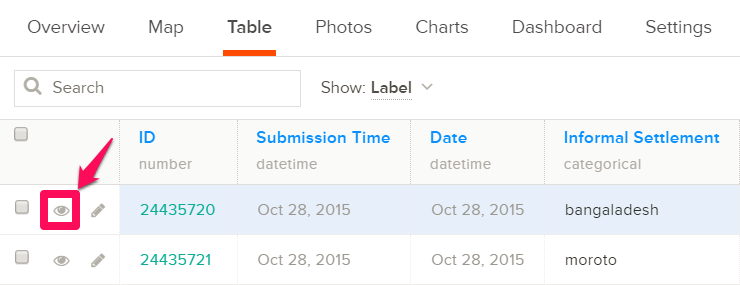
Deleting a single record
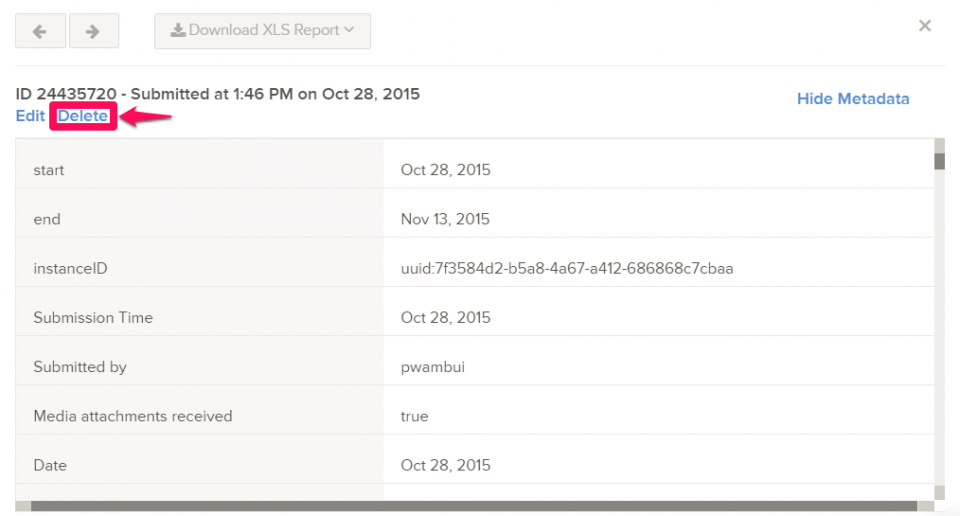
You can also delete a submission from the single submission view modal. Click on the view icon to open the view modal or double-click on a single record to open the modal.
Click on the Delete link to delete the submission.
When you click on the delete link, a Confirm Delete window pops up where you should confirm the deletion of the record.
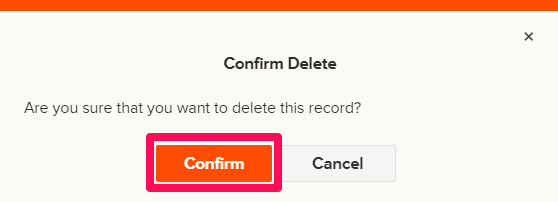
Click on the Confirm button to delete the record.
Importing data from external sources to Ona
ODK Briefcase
ODK Briefcase is used to gather and pull data from (or push data to) an ODK Aggregate server, e.g. ona.io. Additionally, ODK Briefcase can be used to aggregate form submission data from ODK Collect when you are offline
CSV imports
The Import CSV feature is used to upload data to blank forms.
A platform that doesn’t use the XLSForm standard may not be aggregate compatible. In this case, you should use the data export options in the platform to export your data in CSV format first before uploading it to Ona using the Import CSV feature.